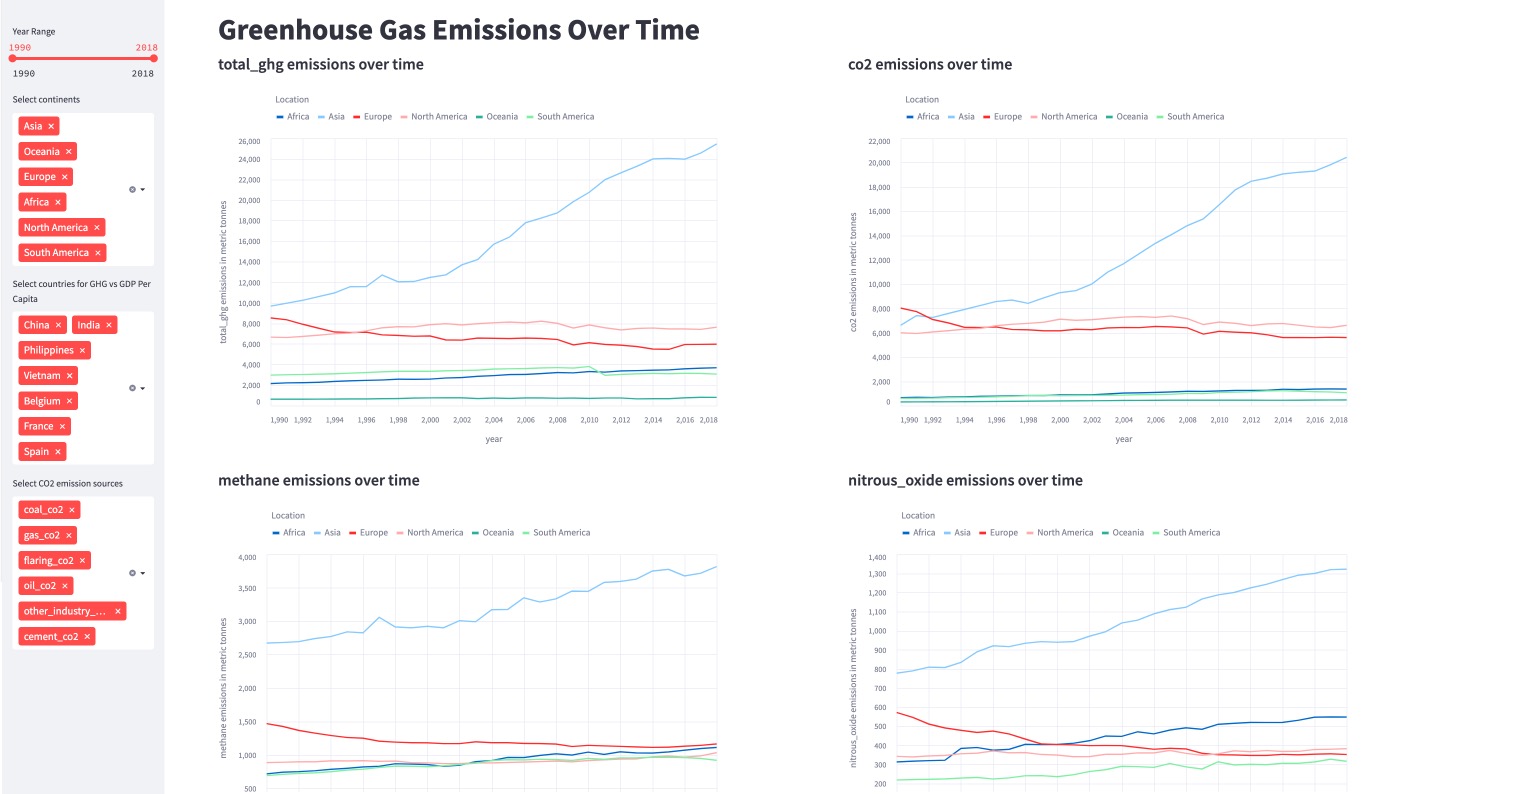
Greenhouse gases are gaseous compounds that are capable of trapping heat in the atmosphere. They include carbon dioxide (CO2), methane (CH4), nitrous oxide (N2O), and fluorinated gases. These gases help regulate the temperature of the Earth by trapping heat that would otherwise escape into space.
Greenhouse gas emissions are important to understand because they contribute to global warming and climate change. An increase in emissions over time means that the world is becoming less sustainable, and the Earth's climate is changing in ways that can be harmful to human and ecological health. On the other hand, a decrease in emissions indicates that the world is taking action to reduce its impact on the environment and reduce the risks of global warming and climate change. Understanding these trends is crucial for making informed decisions about energy production, transportation, and other industrial processes that contribute to emissions.
This streamlit-powered dashboard is meant to show how we can create visualizations using Altair, Pandas, and Python features to understand the changes in the total greenhouse gases emissions over time. The dashboard comes with selectible options wherein we can also see the changes per continent or country depending on the specifications set by the user.
The data used in this project is gotten from the Our World in Data CO2 Emissions dataset.
To run the application, first create a virtual environment. I used miniconda as my virtual environment manager and created an environment with the following command:
conda create --name ghg_emissions python=3.9
conda activate ghg_emissions
The next step is to clone the repository in the virtual environment by running:
HTTPS: git clone https://github.com/gersongerardcruz/greenhouse_gases_emissions_dashboard.git SSH: git clone git@github.com:gersongerardcruz/greenhouse_gases_emissions_dashboard.gitThen, move into the repository and install the requirements with:
cd greenhouse_gases_emissions_dashboard
pip install -r requirements.txt
Finally, deploy the app locally via streamlit by running:
streamlit run app.pyFeel free to add more visualizations by updating utils.py and main.py. This project is definitely a learning space, and I hope you learned something new by reading through and using this project!
