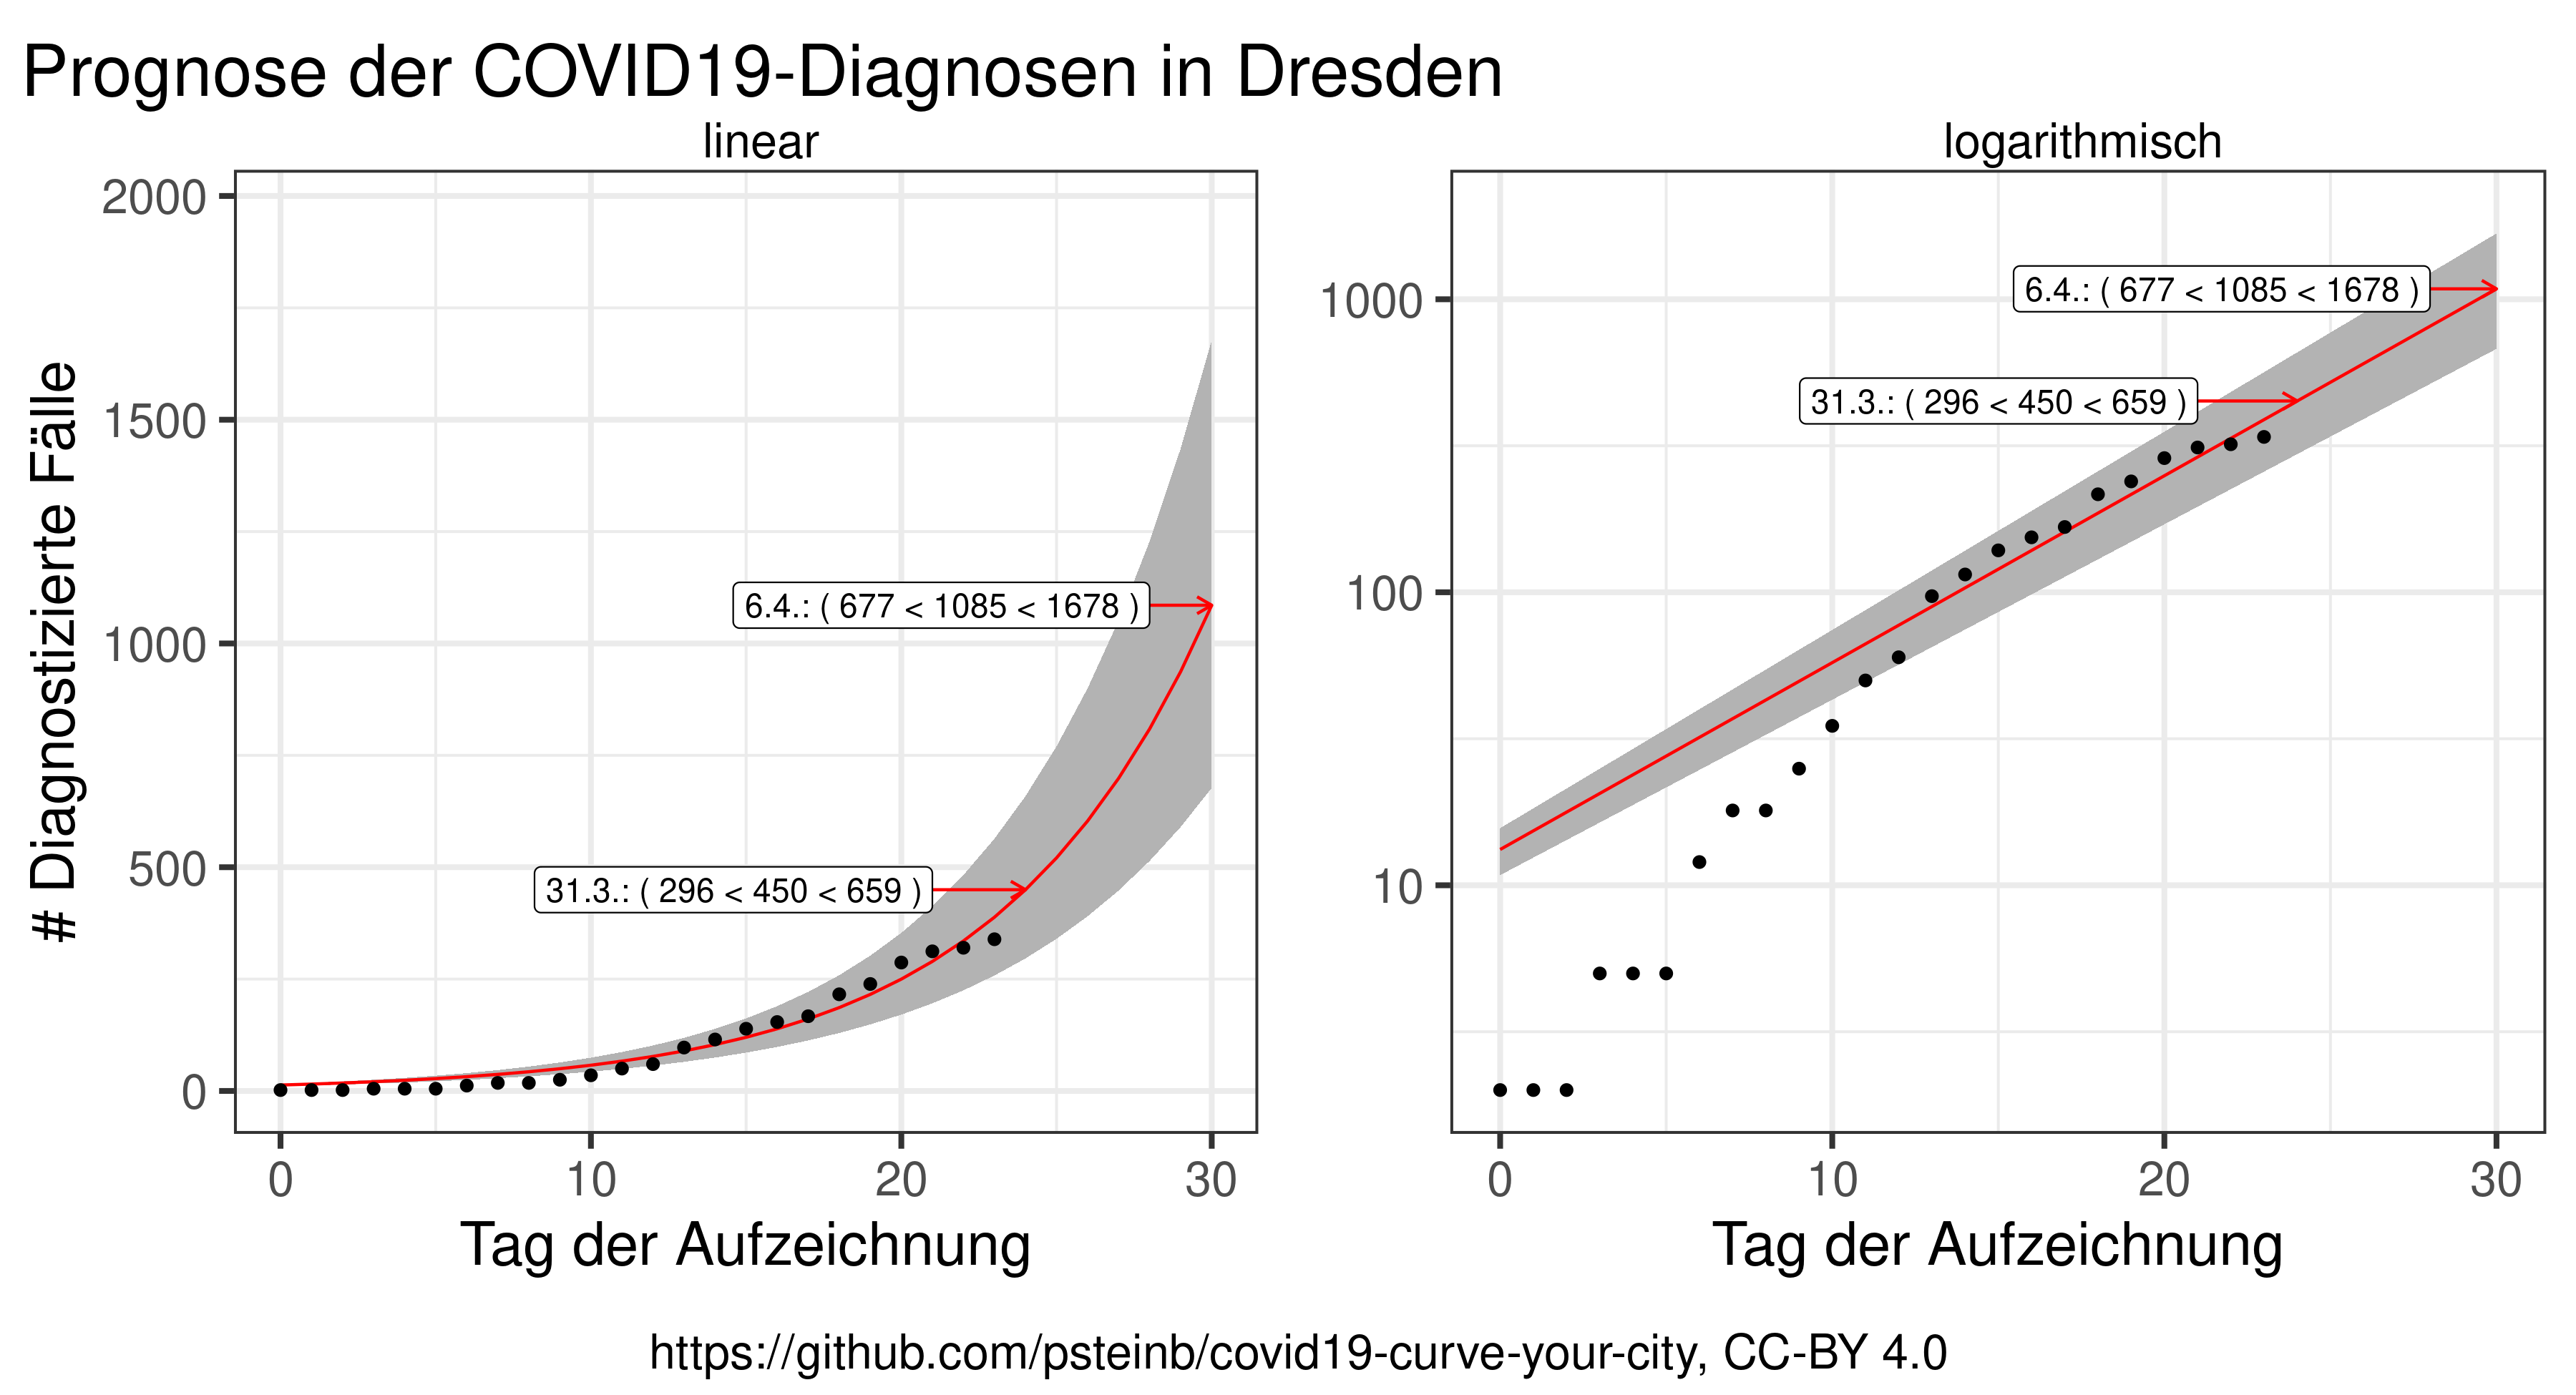
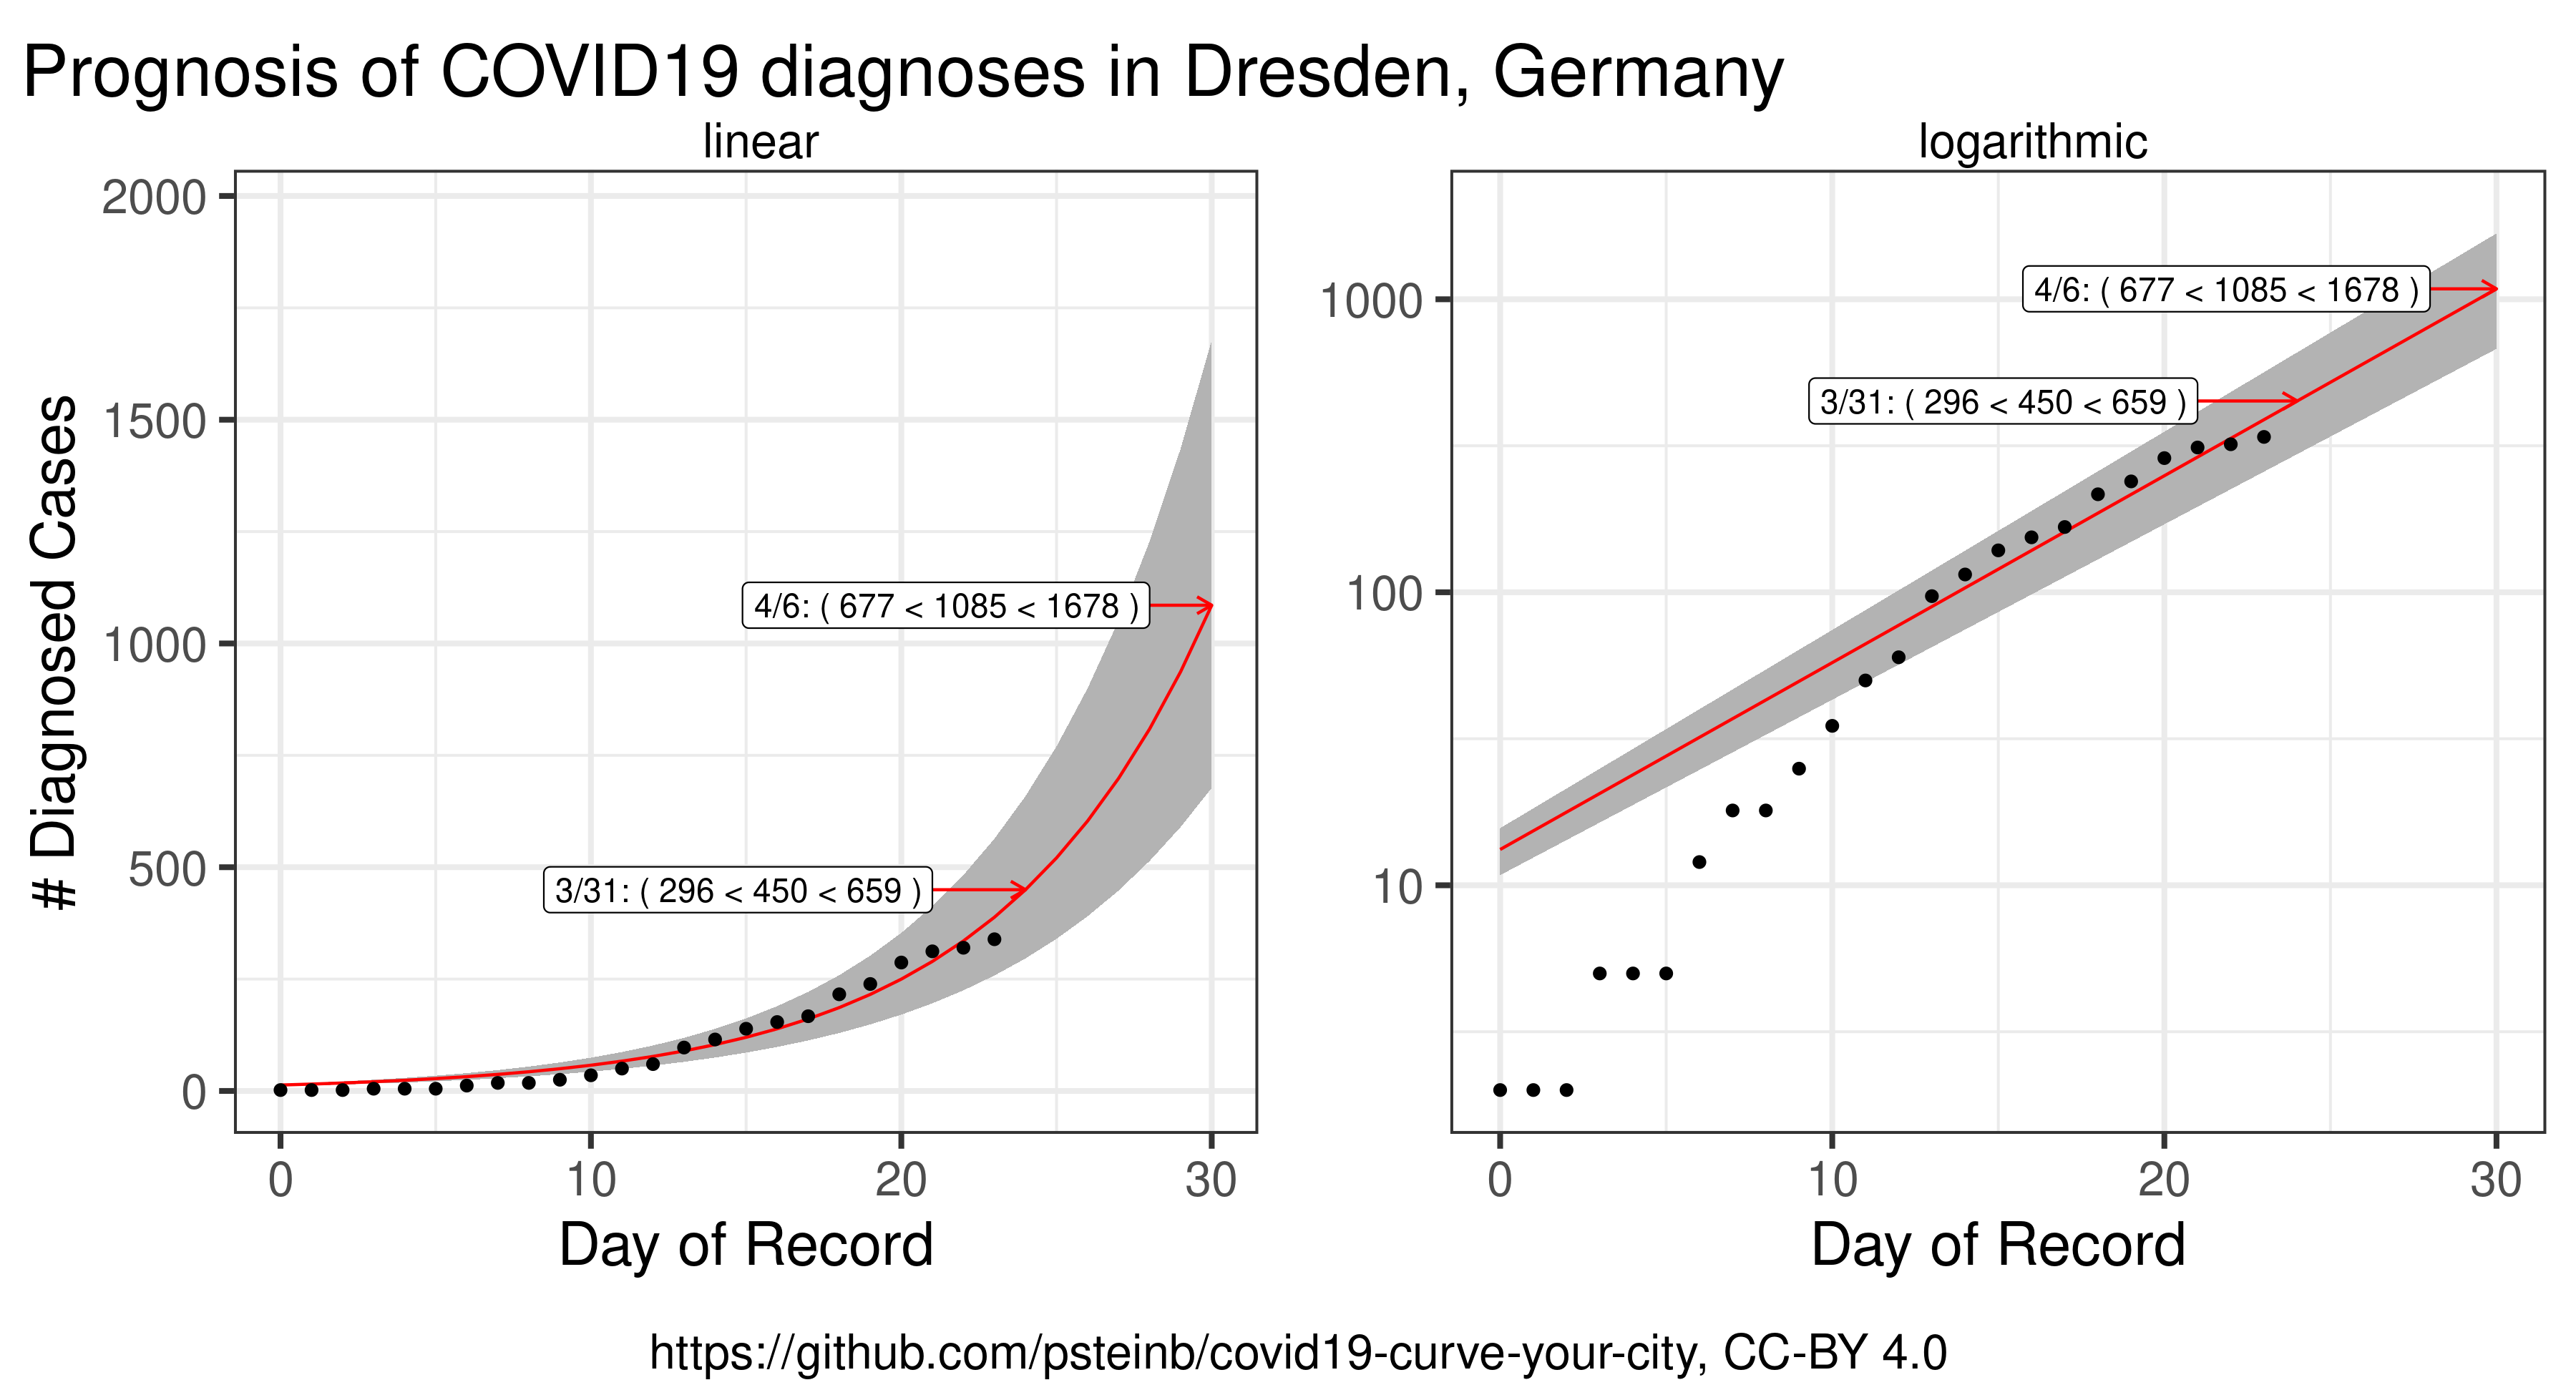
Extrapolierte COVID19-Infektionen
Dresden
Deutsch
Datenquelle: dresden.de
English
data source: dresden.de
Statistik
Deutsch
Für die rote Linie im o.g. Plot benutze ich ein sehr einfaches Modell: das exponentiellen Wachstum der COVID19-Pandemie. Ich fitte die Daten mit einem Least-Squares-Verfahren entsprechend der Formel für das Modell:
diagnosed ~ a*exp(b*day)Wobei a und b freie Parameter sind.
English
For the red line in the plot above, I use a simple model: the exponential growth of the COVID19 pandemia. I fit the data using a Least Squares Algorithm using the formula of the model:
diagnosed ~ a*exp(b*day)Here a and b are free parameters.
Reproduziere das!
German
- R installieren
- Abhängigkeiten installieren
$ R
> install.packages(c("ggplot2","dplyr","readr","optparse", "cowplot"))exponential.R-Script laufen lassen
$ Rscript exponential.R -i de_dresden.csv- Dies produziert zwei Dateien
de_plus7.pngunden_plus7.png.
English
- install R
- install dependencies
$ R
> install.packages(c("ggplot2","dplyr","readr","optparse", "cowplot"))- run
exponential.Rscript
$ Rscript exponential.R -i de_dresden.csv- this produces 2 files:
de_plus7.pnganden_plus7.pngthat contain the plots based onde_dresden.csv

