Time management indicator is an app created to help you assess your time management quality, and also give you some recommendation to make it better.
It already deployed to shiny, just click this link to be the better you: https://gerald.shinyapps.io/Time-Management-Indicator/
Time is one of the things you cannot buy in life. Everyone has the same amount of time each day, but how we spend our time is up to ourselves. There is a quote that inspires me to make this time management app:
"Time is what we want the most, but what we use worst."
- William Penn
The quote speaks for itself, we always say that we need more time to do something or we wish that we can turn back time because we regret not doing something in the past.
Because of those reasons, we decided to make this app so you and hopefully all people will be a 'good' time manager for your time. 😉
We use the datasets from Kaggle's Students Time Management Datasets for this project.
Before we use it to make a model for assess your time management quality and the recommendation, it is very important to take a little look how is the data. Therefore I will start this project with the 'EDA' part.
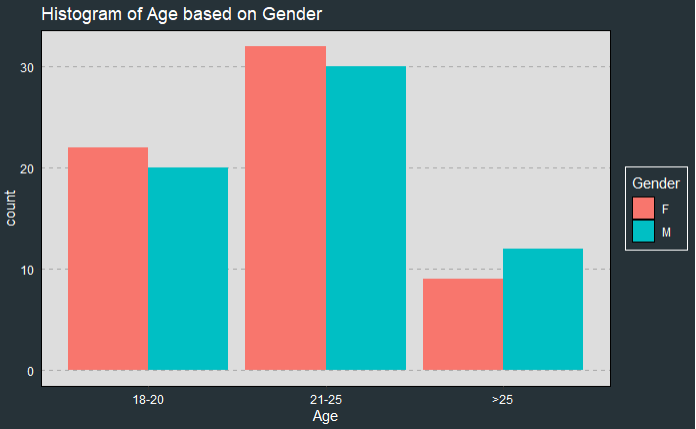
The author of the dataset create this dataset using a questionnaire,therefore we'll strat the EDA part with the common parameters, which are age and gender.
From the plot above, we can see that the order of the group of age from many to least are:
- The group age of 21-25 years old
- The group age of 18-21 years old
- The group age above 25 years old
It may be a slightly setbacks because the data did not have a large range of age, so we decided to group it and use that grouping of age to make the model.
In the matter of gender, it seems the number of female and male respondents are pretty equal. So, if we make the model use this data it is not gender's bias and can be a pretty good model.
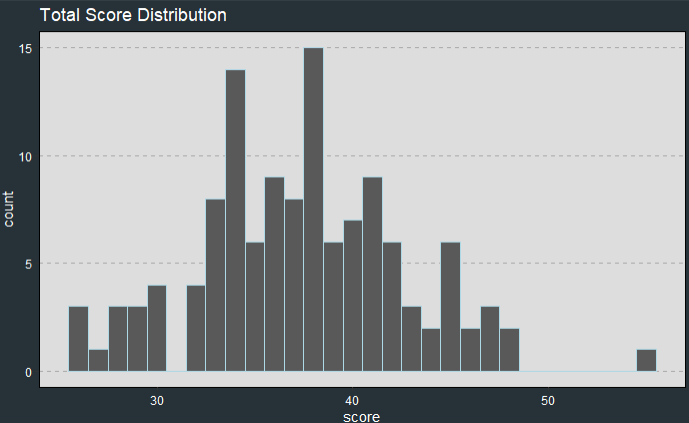
After talking about the gender and age of the respondents, next we'll move into the question's part. We have done some feature engineer to the data and make one additional variable, which is score. The questions have a likert scale answers, in the scale of 1-5. We use the scale to make the 'score' variable by adding all the answers, which will get us a maximum score of 60 and minimum score of 12 and here is the distribution:
Fortunately, the distribution is quite good, so we can use this data to build the model. 🥳
It seems the data is normally distributed, but there is an outlier (a score above 50).
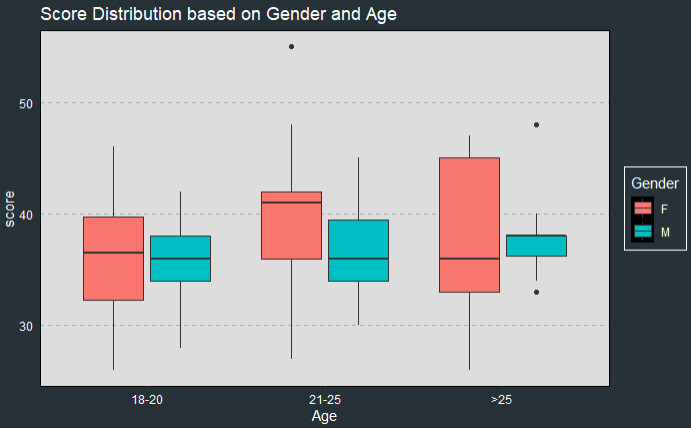
For the last EDA part, we will check the boxplot of the score based on age and gender.
- The plot above looks like that female slightly has a higher score than the male in every group of age,
- The worst score is in the age of 18-20,
- The highest score of female is in the group age of 21-25 and male in the group age above 25.
For the conclusion of this part we will give you three important points:
- Age and Gender affect time management scores
- The score distribution is normally distributed
- There is an equal number of each gender
For the clustering part, we used K-Prototypes to determine the time management quality.
We use K-Prototypes method because the algorithm is similiar with the famous clustering method (K-means), but the advantage of this method is, it can be used for mixed type data which what our data look likes now.
Before do clustering part, we try to determine the number of clusters using Elbow Method. Elbow Method consists of plotting the explained variation as a function of the number of clusters, the number of cluster is on elbow of the curve.
From the plot there is a sharp elbow of the curve on number 3. Thus, we set the number of clusters into three time management qualities:
-
Good Time Management Quality
-
Normal Time Management Quality
-
Bad Time Management Quality
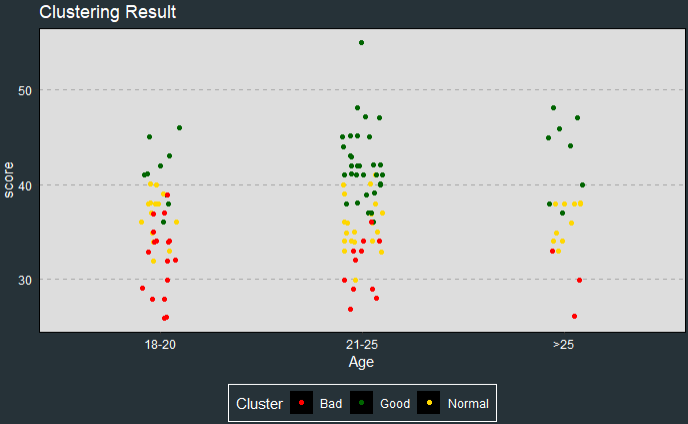
After obtaining the number of clusters, we begin to cluster the data, and this is the result that we get,
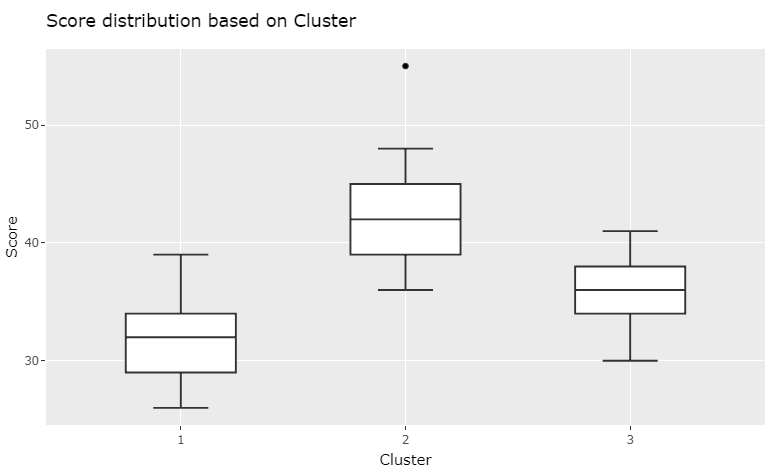
From the graph, if you look at the group of Good Time Management Quality, it has a higher scores (above 40), and it seems that the higher the scores, the better the time management quality.
But that is not the case, we were clustering or grouping the data not only depending on the scores but also the answer to each question for the grouping. That will explain how some data with lower scores get the Good Time Management Quality and some data with higher scores get Bad Time Management Quality or Normal Time Management Quality.
We determine the name of the group based on the boxplot of scores according to the group cluster,
We manually name it from the boxplot above from higher score to lower score as:
- Group number 2 (has the highest scores) as a group of 'Good Time Management Quality'.
- Group number 3 (has score between grou 1 and 3) as a group of 'Normal Time Management Quality.'
- Group number 1 (has the lowest scores) as a group of 'Bad Time Management Quality'.
We use 'Association rules' algorithm differently for this project. It still have the same parameters of the original association rules algorithm like:
- Left Hand Side (LHS) : It is also called as antecendent, it is the event or action that happened before another. The action in LHS will affect the outcome of RHS
- Right Hand Side (RHS) : It is also called as consequent.This is the event that happened as the result or effect of what event done in the LHS.
- Support : An indication of how frequently the item set appears in the dataset.
- Confidence : An indication of how often the rule has been found to be true.
- Lift : The ratio of the observed support to that expected if X and Y were independent.
But for this project, the purpose of this model is to detect what aspect or event that will lead to 'Good Time Management Quality' or 'Bad Time Management Quality'.
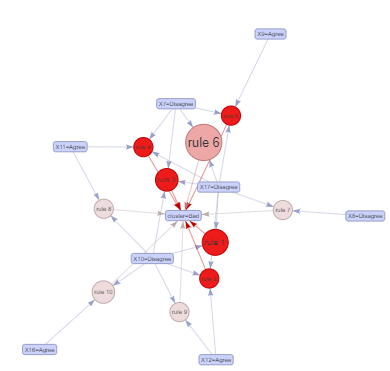
For achieving the purpose above the RHS is set to a two different group which are 'Good' and 'Bad'. For the LHS, all variable (gender, age, and 12 questions) are used. From the example below, the rules that are used only rules with 1 confidence level, that means if you do that, most likely you will have that result from the RHS.
From the plot above, we could take the first rule as our example:
- LHS -> X10: Disagree and X17: Disagree
- RHS -> Cluster: Bad
- Support : 0.072
- Confidence : 1
From the result above we try to translate it into a single statement below:
The probabilty of a person answer X10 ("You will plan your activities day to day") and X17 ("You know how much time you spend on each of the work you do") with disagree is 0.072. If you are one of them, you will 100% get into cluster 'Bad Time Management Quality'.
The plot below is the visualization for the table above, it is actually an interactive plot, try it on the app 😉
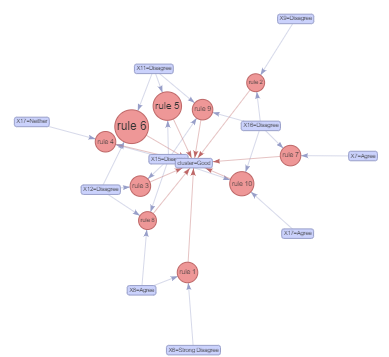
How to read the plot above is the same with 'Bad Time Management Quality' table, but we will explain it once more
- LHS -> X6: Strong Disagree and X8: Agree
- RHS -> Cluster: Good
- Support : 0.064
- Confidence : 1
The probability of a person answer X6 ("You often feel that your life is aimless, with no definite purpose") with strong disagree and X8 ("Once you've started an activity, you persist at it until you've completed it") with agree is 0.064. If you are one of them, you will 100% get into cluster 'Good Time Management Quality'.
The plot below is also the visualization of the table above,
For more understanding about how we use the association rules without transactions and itemset, you can visit this page.
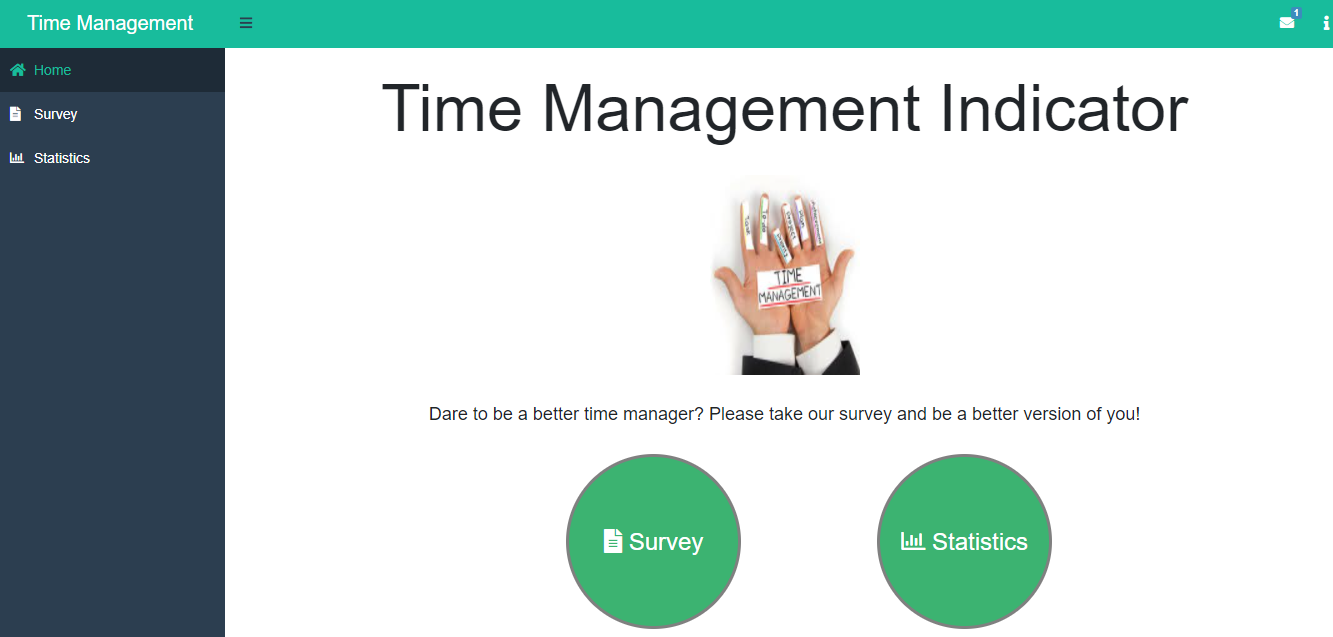
Here is the landing page of the Time Management Indicator app. What you can do in the home page?
- About menu (in the top right corner) : See the summary, purpose, and sources of this app.
- Messages : Welcoming messages from us to welcome you.
- Statistics : See what it shown in statistics menu.
- Survey : See what it shown in survey menu.
Fill your details in the main page's lift side and then click 'Start Test,' and then it will bring you to the survey part.
After finishing, fill out the twelve questions:
-
Click the OK button.
-
Remember to be honest when you fill it so that you can get your actual result.
-
Don't be hesitate to fill it, because we do not keep your data. After you close the app, the data will be gone.
-
Your result will be shown as a ' * ' shape. See the example below,
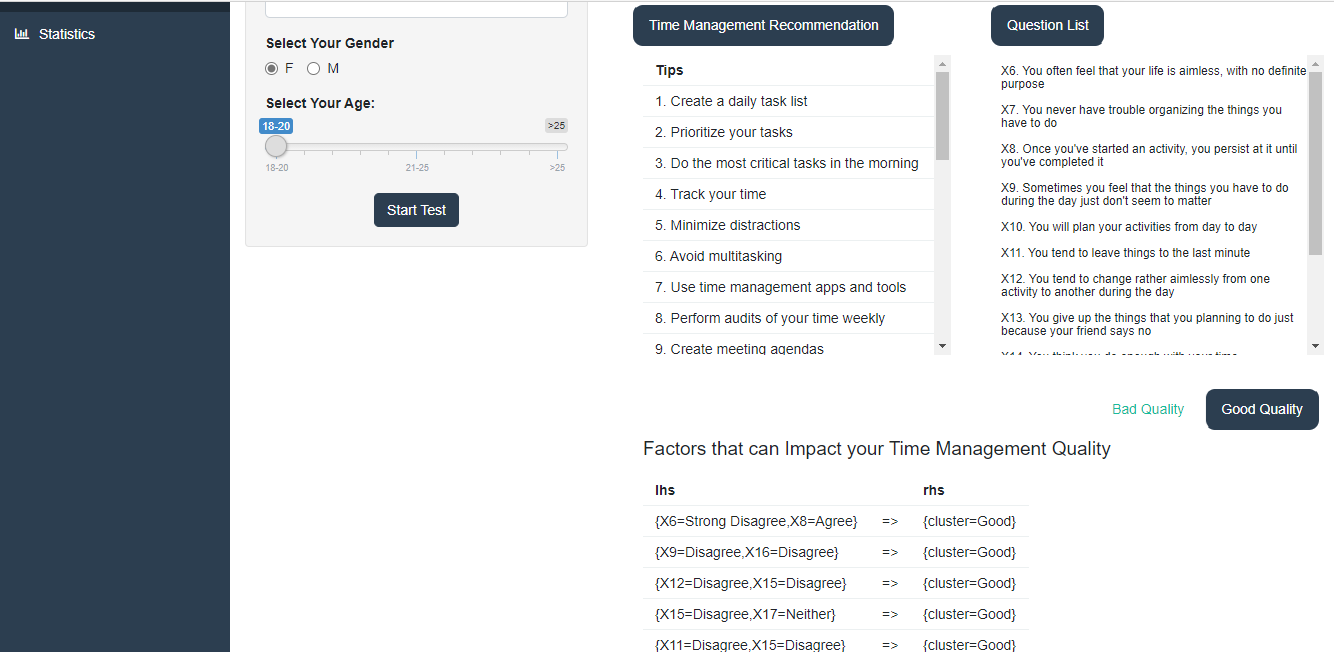
There are three parts to this menu:
-
Recommendation
In the recommendation part, we use the recommendation from the expert (you can see the detail from this page) to make you have the better time manager. There are some example of recommendations or tips like 'create a daily task', 'prioritize your task', and 'avoid multitasking' that will improve your time management quality. -
Question List
The question list in this menu is to support the 'Factor that Impact your Time Management Quality' part. In this part we provide the question descriptions behind the variable 'X1' through 'X12'. -
Factor that Impact your Time Management Quality.
In this part, we use the association rules model to encourage you what the answer will bring you to be in a 'Good Time Management Quality' or 'Bad Time Management Quality'. Besides that, it can be used as the recommendation too.This is how you read the result : In the 'LHS' column is what the action that will trigger you to get the result in 'RHS' column.
I will explain it step by step:
- See the 'LHS' part, in the first example it has 'X6 : Strong Disagree' and 'X8 : Agree',
- Go the the Question list and check what the question decsription between 'X6' and 'X8',
- See the 'RHS' part, we get the result of 'Good'. (It means that if we agree on 'X8' and Strong Disagree on 'X6', we will more likely to have a good time management quality)
- Implement it in real life! (It is a must 😉)
In this menu we divide it into two big menu which are 'clustering' and 'association rules'. It consist all of what we have been explained in the clustering and Association rules part.
I do not want you to take more time to read this, so just head to the shiny app, take the survey, and most important, improve your time management quality no matter what groups you belong to.
Lastly, I want to provide you with another quote that I like:
"The bad news is time flies. The good news is you are the pilot"
-Michael Altshuler
Thank you for reading and use the app. 😄
If you have any feedback, feel free to contact me.
Cheers to the better us! 🥂
