This repository is currently a sandbox for mathematical investigations into exceptional structures and dynamics on graphs.
The studies will be inspired by the concepts covered in Norman J. Wildberger's Wild Egg Maths channel on youtube.
The first exercise on the mutation game can be found here:
DoG 1: The Mutation Game and a foundational exercise / challenge | Explore Research Maths | Wild Egg
In the video linked above, Dr. Wildberger discusses the mutation game on graphs and presents the following exercise / challenge:
Which simple graphs
Xhave a finite number of root populations?
A root of X is a population obtainable from a singleton population by successive mutations.
Let R(X) ≡ roots of X
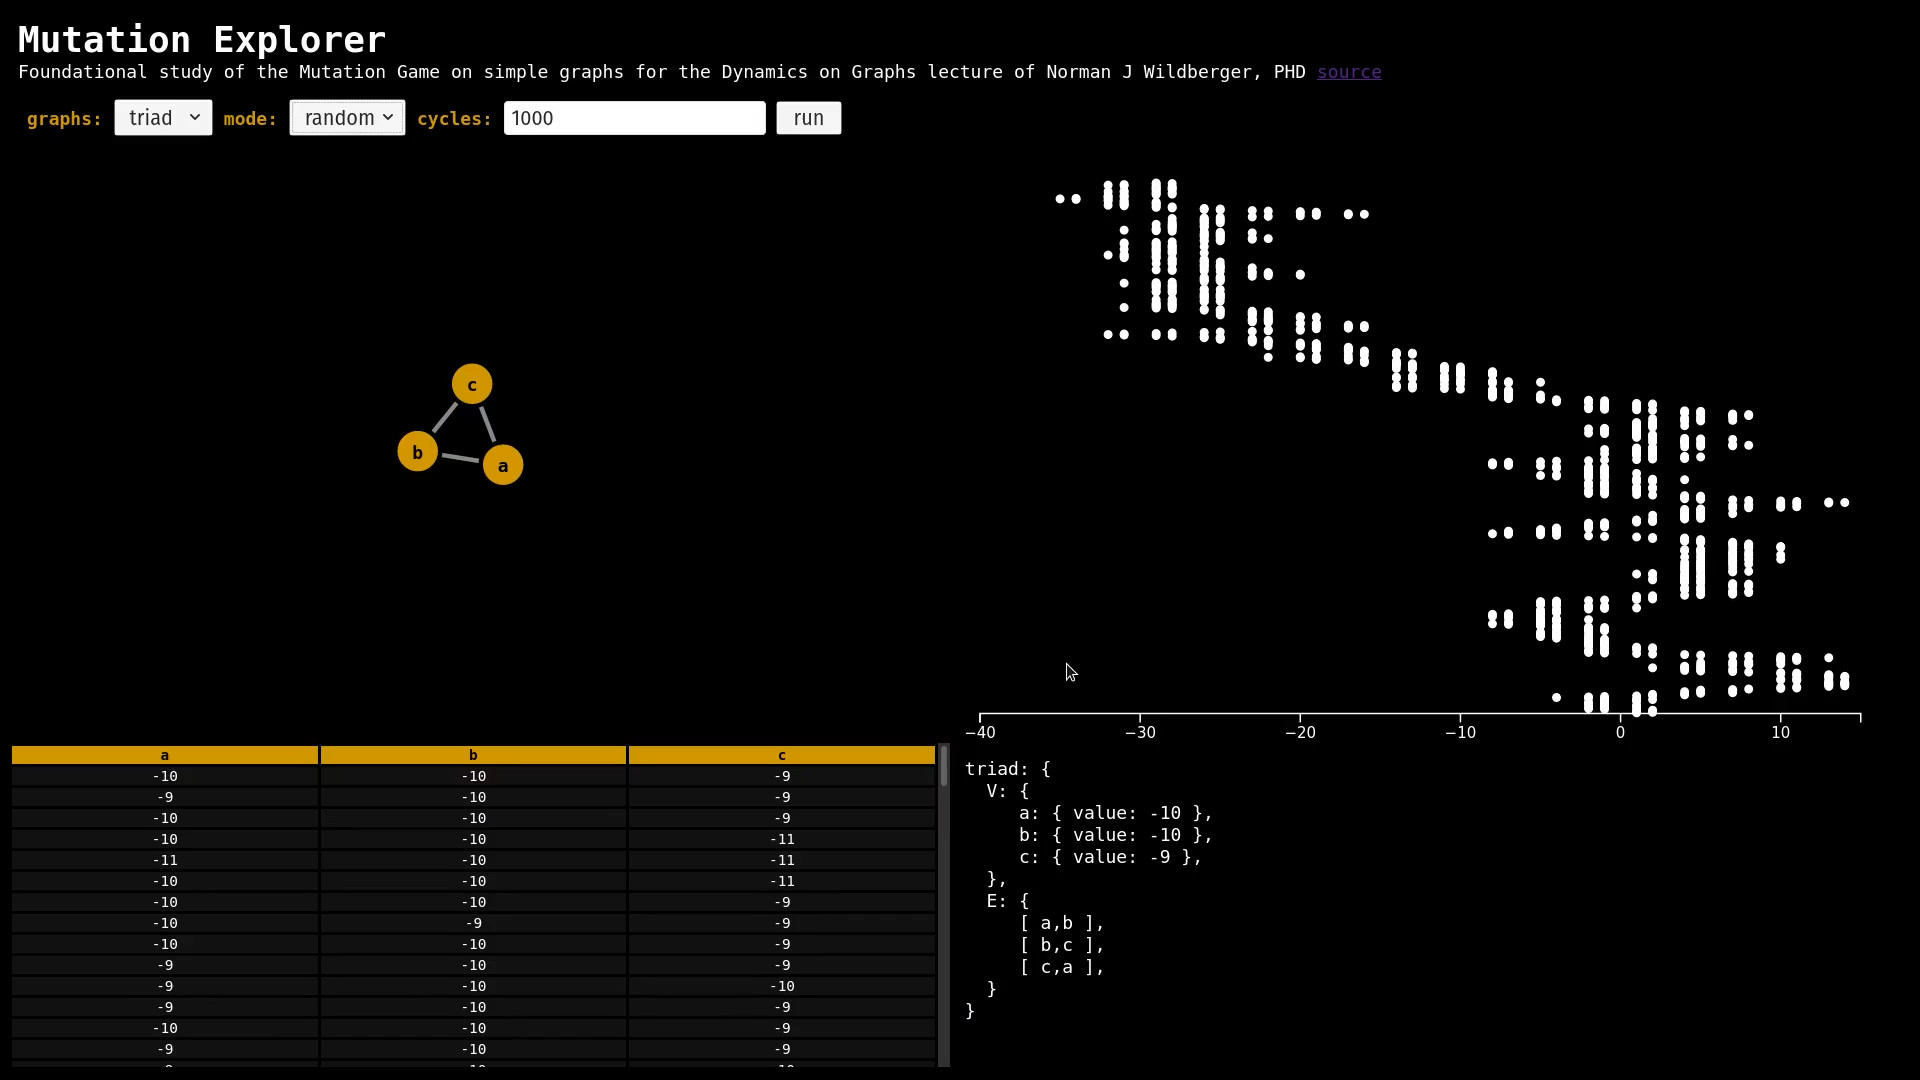
This first project presents a test rig for playing the mutation game on selected graphs
I have built a test rig using HTML, CSS, JS. And I have included one library: D3
D3 is handling the rendering of the graph (upper-left), the population history table (lower-left), and the population history plot (upper-right).
Each graph is defined as a simple JS structure of vertices V and edges E
simple: {
  V: {
    x: {},
    y: {},
    z: {},
    w: {}
  },
  E: [
    [ "y", "x" ],
    [ "y", "z" ],
    [ "y", "w" ],
    [ "z", "w" ]
  ]
}
Before the game is run the graph is set with a singleton population - where all the vertices are given a value of zero except the first, which is given a value of one.
This test rig will run the mutation operation on the vertices for a set number of iterations (cycles). You can choose whether to select a random vertex each time or run round-robin.
The mutation operation is simple - negate the value of the selected vertex and add the sum of the values of the neighboring vertices.
At each iteration, the population is added to a history array which is then displayed as a table and plot - starting from bottom to top.
The points on the plot show the sum of the population at each iteration.
- Determine the set of root populations
- Determine min-max sum of populations
- Plot vertex values

