This is by no means a valid or peer-reviewed analysis of the COVID-19 outbreak. Opinions or assumptions expressed in this document and project are my own.
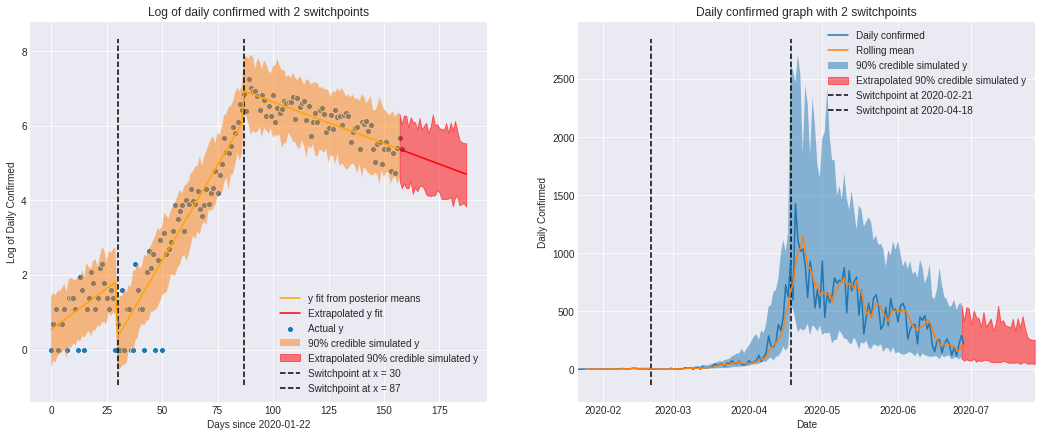
- The first segment, prior to 21-02-2020, shows Singapore's initial aggressive response to the virus.
- From 21-02-2020 to 18-04-2020, Singapore's cases rose exponentially, possibly due to a large number of imported cases and it's spread in Europe.
- From 18-04-2020 to 28-06-2020, the change in trend can be associated with a call to a "circuit breaker" which started 07-04-2020.
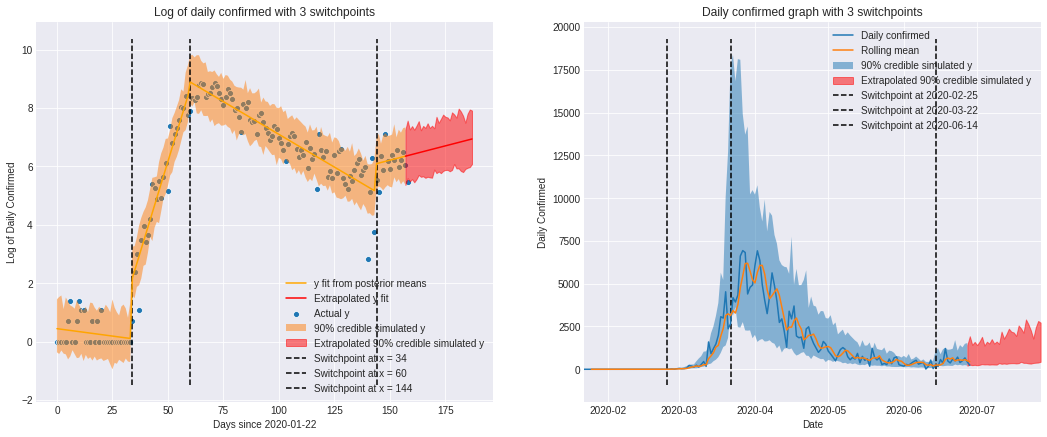
- It is observed that similar to Singapore, the virus started spreading quickly from 25-02-2020.
- The change to a downward trend is observed after 22-03-2020, after a series of aggressive measures similarly taken by the German government, and a lockdown introduced in Baravia in 20-03-2020.
- From the start of June, various states began lifting lockdown measures, possibly attributing to a slight increase in cases identified in the switchpoint at 14-06-2020.
Focusing on the COVID-19 spread in Germany and Singapore, I detect change points in the raw data of number of confirmed daily cases by running the data through a segmented regression model with K arbitrary "switchpoints" that are learned by the model. The change points in the effective growth rate correlate well with the time of publicly announced tightening or easing of lockdown/ social distancing measures. The aim of this project is to quantify the effect of interventions and extrapolate the exponential model into the future for forecasting purposes.
The data accrued is publicly hosted on Kaggle: https://www.kaggle.com/imdevskp/corona-virus-report/data?select=covid_19_clean_complete.csv
The python class in KSegmentsModel.py encapsulates the model and data visualisation tools necessary for analysis. Examples of the resultant output are shown in the Examples section. Usage of the class is shown in Workbook 2.
The data is first parsed into the correct format by including a DataFrame column that includes the daily confirmed counts in each country. Under the assumption that the virus spreads exponentially, I created another column that computes the log of this data, allowing for linear analysis. I then fit a segmented linear regression model using pymc3 on the given data. The segmented linear regression model allows for an arbitrary number of K switchpoints by nesting together a bunch of switch statements identifying the changes in trend in the given observations. I then transform the fitted model, along with it's 90% credible intervals, back to the raw data of daily counts, and further extrapolate the model days_after days into the future for forecasting purposes.

