Backtest-Indicator-Strategies
Backraded different trading strategies implemented using following indicators - SMA, EMA, WMA, RSI, MACD, MACD Histogram, Bollinger Bands, and a custom one too(made of linear combination of various conventional indicators).
Install
This project uses backtrader. Go check them out if you don't have them locally installed.
$ pip install backtrader[plotting]
Interpretation
Simple moving average -
Used mainly to identify trends, works by smoothing out past price data. There are two main ways to use the simple moving average. The first is trend analysis.
-
At a very basic level, traders and investors use the SMA to assess market sentiment and get an idea of whether the price of a security is trending up or down. The basic rule for trading with the SMA is that a security trading above its SMA is in an uptrend, while a security trading below its SMA is in a downtrend.
-
55 MA initially tracks above the market as a line of resistance. The market then bottoms and reverses and the 55 MA then becomes the dynamic level of support. This method can be used across many markets, including foreign exchange, indices and stock markets.
A bullish crossover occurs when a security's price moves back above the SMA after being below it. This action signals that the downtrend or correction is over and a possible uptrend is starting. A bullish crossover can be used as a signal to enter a long trade. A bearish crossover occurs when a security's price falls below the SMA after trading above it.
Conventional Moving Average Trading Strategy -
Initial Portfolio Value: 1000.00
Sharpe Ratio: OrderedDict([('sharperatio', 0.39712152328944345)])
Final Portfolio Value: 1098.22

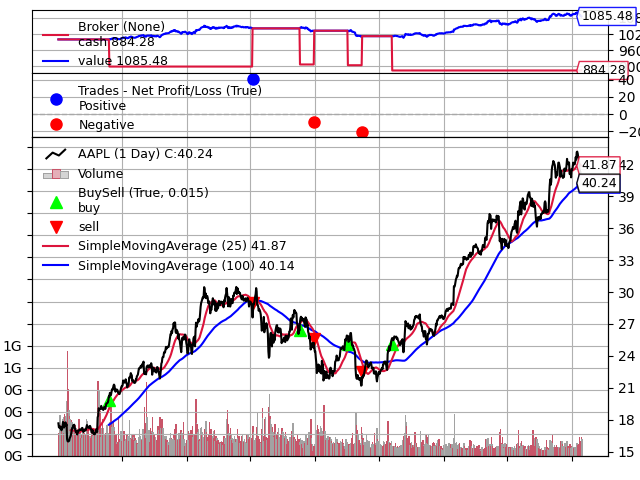
Moving Average Crossover Strategy -
Another popular strategy with the SMA is the moving-average crossover. This occurs when a short-term SMA crosses over a long-term SMA.
Initial Portfolio Value: 1000.00
Sharpe Ratio: OrderedDict([('sharperatio', 0.25661641178217337)])
Final Portfolio Value: 1085.48
Some traders and investors believe that SMA is flawed because every data point has the same weight. They argue that current data is more important than previous data and should therefore have a higher weight. As a result, some traders and investors prefer to use another form of moving average, known as the exponential moving average (EMA).
Initial Portfolio Value: 1000.00
Sharpe Ratio: OrderedDict([('sharperatio', 0.1986051377191423)])
Final Portfolio Value: 1076.14

Weighted Moving Average -
Initial Portfolio Value: 1000.00
Sharpe Ratio: OrderedDict([('sharperatio', 0.48141996900992085)])
Final Portfolio Value: 1110.45

Momentum indicators are tools utilized by traders to get a better understanding of the speed or rate at which the price of a security changes(regardless of the direction the price moves up or down). Momentum indicators are also specifically useful, as they help traders and analysts spot points where the market can and will reverse.
Momentum = SMA(now) - SMA(N-periods ago)
The points are identified through divergence between price movement and momentum. A market in motion tends to stay in motion rather than reverse. This is the reason why a momentum indicator strategy is so powerful. Using a momentum indicator strategy, it means we're going to hold the trade for a short period of time. Anywhere between a few minutes and up to a few days. Basically, the best momentum trading strategy runs until the momentum drys out. When momentum reaches a certain "extreme" level, traders may consider this level of momentum to be unsustainable and use it as a price reversal indication. Though the traditional approach of investing, in particular, is to "buy low and sell high", the momentum approach equates to either "buy high and sell higher" or "sell low and sell lower". It's believed that trading securities while they're moving the fastest is the best time to make money in them.
Momentum in finance is based on the following key factors:
-
Volume - Volume is vital to momentum traders, as they need to be able to enter and exit positions quickly, which relies on there being a steady stream of buyers and sellers in the markets.
-
Volatility - Momentum traders will seek out volatile markets, in order to take advantage of short-term rises and falls in an asset's value. As momentum trading attempts to capitalise on volatility, it is important to have a suitable risk management strategy in place to protect your trades from adverse market movements.
-
Time Frame - Momentum trading strategies are usually focused on short-term market movements, but the duration of a trade can depend on how long the trend maintains its strength.
eg. Stochastic oscillator indicator, RSI index, Moving averages, Momentum indicator(It takes the most recent closing price and compares it to the previous closing price, which can be used to identify the strength of a trend.)
Relative Strength Index -
The relative strength index (RSI) is a momentum indicator used in technical analysis that measures the magnitude of recent price changes to evaluate overbought or oversold conditions in the price of a stock or other asset. The RSI is displayed as an oscillator (a line graph that moves between two extremes) and can have a reading from 0 to 100. Traditional interpretation and usage of the RSI are that values of 70 or above indicate that a security is becoming overbought or overvalued and may be primed for a trend reversal or corrective pullback in price. An RSI reading of 30 or below indicates an oversold or undervalued condition.(Buying when the indicator crosses 30 to the upside means you are counting on the trend reversing and then profiting from it. The same is true for selling when the RSI crosses down below 70 and using this a sign that the market is reversing from a strong uptrend.)
RSI Divergences -
-
A bullish divergence occurs when the RSI creates an oversold reading followed by a higher low that matches correspondingly lower lows in the price. This indicates rising bullish momentum, and a break above oversold territory could be used to trigger a new long position.
-
A bearish divergence occurs when the RSI creates an overbought reading followed by a lower high that matches corresponding higher highs on the price.
RSI Swing Rejections -
Another trading technique examines the RSI's behavior when it is reemerging from overbought or oversold territory. This signal is called a bullish "swing rejection" and has four parts:
- RSI falls into oversold territory.
- RSI crosses back above 30%.
- RSI forms another dip without crossing back into oversold territory.
- RSI then breaks its most recent high.
However, you cannot ignore the huge failings of the RSI indicator in a strong trend! :
-
It can stay at 90 for days on end, dancing above the overbought line like it is on speed at a london rave in 1992!
-
The problem faced by every trader who uses the RSI indicator is that the market may well continue in its trend despite the fact that it hit an extreme reading, It might even go on to leave that price level behind in the distance depending on the strength of the trend. For this reason there came about the concept of the failure swing, in order to interpret the index better.
-
Divergence : Positive divergence happens when the price of an asset is drifting lower yet the RSI is starting to trend higher. This could mean that the price is nearing a bottom and will probably turn up soon. Negative divergence happens the opposite way, the price is driving higher, but the RSI has stalled and is beginning to turn lower. When this occurs it is likely that the price will stop rising soon after. And then follow the RSI lower.
Initial Portfolio Value: 1000.00
Sharpe Ratio: OrderedDict([('sharperatio', 1.4432523372959551)])
Final Portfolio Value: 1245.13

Moving Average Convergence Divergence (MACD) -
MACD = EMA(26 Period) - EMA(12 Period)
A nine-day EMA of the MACD called the "signal line," is then plotted on top of the MACD line, which can function as a trigger for buy and sell signals. Traders may buy the security when the MACD crosses above its signal line and sell, or short, the security when the MACD crosses below the signal line.
Three of the most popular strategies include:
-
Crossovers: The MACD line and signal line can be utilised with the crossover between the two lines providing buy and sell signals. As with most crossover strategies, a buy signal comes when the shorter-term, more reactive line -- in this case the MACD line -- crosses above the slower line -- the signal line. As the crossover strategy is lagging by nature, it is based on waiting for a movement to occur before opening a position. The main issue faced by the MACD in weaker market trends, is that by the time a signal is generated, the price may be reaching a reversal point. This would then be considered a 'false signal'.
-
Histogram reversals: The histogram is arguably the most useful part of MACD, with the bars representing the difference between the MACD and signal lines. When the market price is moving strongly in a direction, the histogram will increase in height, and when the histogram shrinks, it is a sign the market is moving slower.This means that as the bars on the histogram move further away from zero, the two moving average lines are moving further apart. Once the initial expansion phase is over, a hump shape will likely emerge -- this is a signal that the moving averages are tightening again, which can be an early sign that a crossover is impending. This is a leading strategy, in contrast to the lagging crossover strategy mentioned above. The histogram reversal is based on using known trends as the basis for placing positions, which means the strategy can be executed before the market movement actually takes place. The chart below highlights the potential to utilise the MACD histogram as a trading tool. By waiting for two counter-trend moves in the histogram, it mitigates the chance that such a move will be a one-off rather than a reversal. By using the tool in the direction of the trend, the chart below highlights three profitable trades and one losing trade. A trader can also use the tool for exiting the trade, with positions exited once the MACD starts to reverse into the opposite direction.
-
Zero crosses: The zero cross strategy is based on either of the EMAs crossing the zero line. If the MACD crosses the zero line from below, a new uptrend may be emerging, while the MACD crossing from above is a signal that a new downtrend may be starting. Slowest of all 3
Initial Portfolio Value: 1000.00
Sharpe Ratio: OrderedDict([('sharperatio', 0.5763823669276101)])
Final Portfolio Value: 1106.21

The Bollinger Bands consist of three bands, which revolve around a centred simple moving average (SMA), with the default value of 20, of which 85% of the time, the price is held within the following boundaries:
Lower band -- SMA (minus two standard deviations)
Upper band -- SMA (plus two standard deviations)
When using trading bands, it is the action of the price (or price action) as it nears the edges of the band that should be of particular interest to us. As you lengthen the number of periods involved, you need to increase the number of standard deviations employed. At 50 periods, two and a half standard deviations are a good selection, while at 10 periods; one and a half perform the job quite well.
Double Bollinger Bands (DBBs) -
Plot 2 pairs of bollinger bands - (20, 2) and (20, 1). These bands represent four distinct trading zones used by traders to place trades.
The Buy Zone is between lines A1 and B1
The Neutral Zone 1 between lines B1 and X
The Neutral Zone 2 between lines X and B2
The Sell Zone is between lines B2 and A2
Basically, if the price is in the upper zone, you go long, if it's in the lower zone, you go short.
Bollinger Band Breakout Strategy -
You take a long position if the previous close breaks above the upper band. You take a short position if the previous close drops below the bottom channel.
Initial Portfolio Value: 1000.00
Sharpe Ratio: OrderedDict([('sharperatio', 0.49109923832780833)])
Final Portfolio Value: 1110.46

Counter - Trend Trading Indicator Strategy -
Works good if the market in the chart featured is mostly in range-bound state. When the market approaches one of the bands, there is a good chance we will see the direction reverse sometime soon thereafter. A counter-trender has to be very careful however, and exercising risk management is a good way of achieving this. An RSI can be added as a filter to try and improve the effectiveness of the signals generated by this Bollinger band trading strategy. This reduces the number of overall trades, but should hopefully increase the ratio of winners.
Initial Portfolio Value: 1000.00
Sharpe Ratio: OrderedDict([('sharperatio', -0.8884289984436338)])
Final Portfolio Value: 985.23

And finally, results from our custom indicator strategy -
Linear Combination of Signals -
Initial Portfolio Value: 1000.00
Sharpe Ratio: OrderedDict([('sharperatio', -0.7636471217079026)])
Final Portfolio Value: 990.46

Contributing
Feel free to dive in! Open an issue or submit PRs.