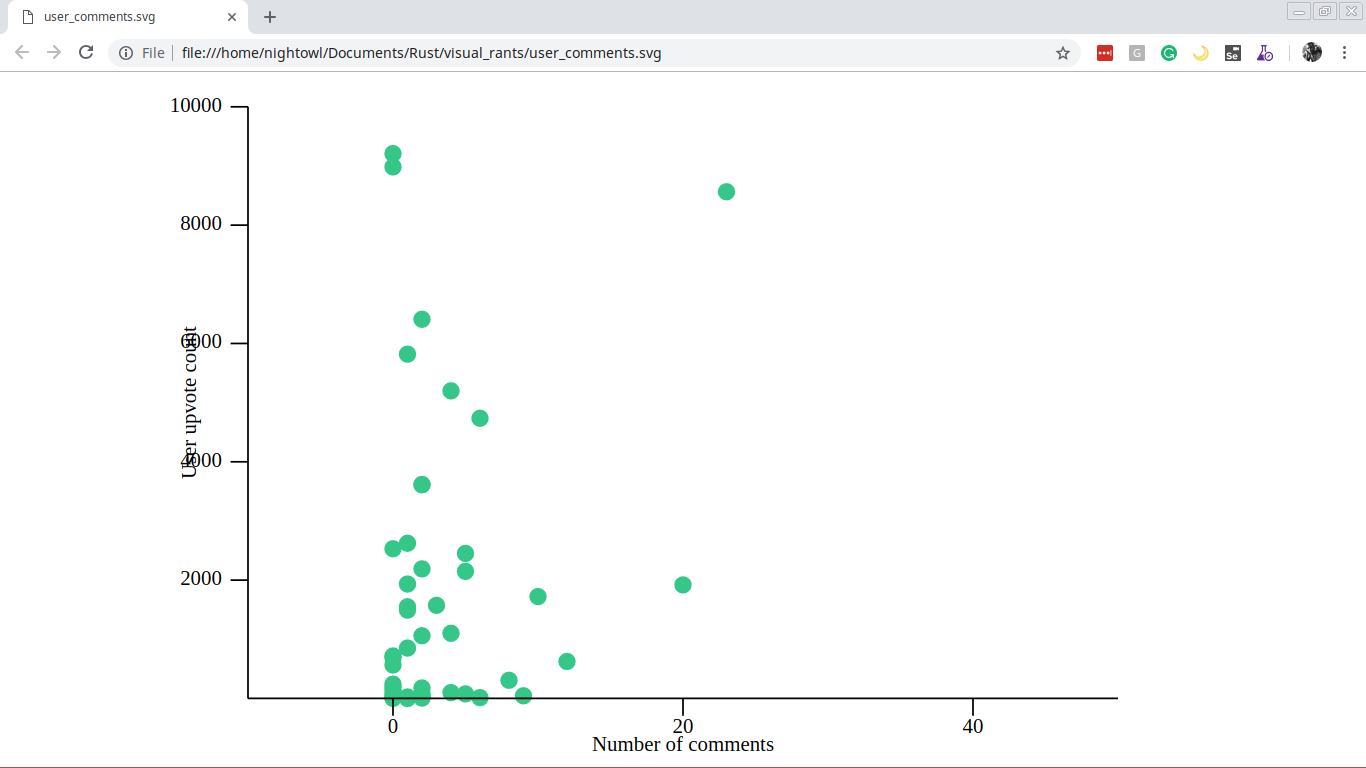
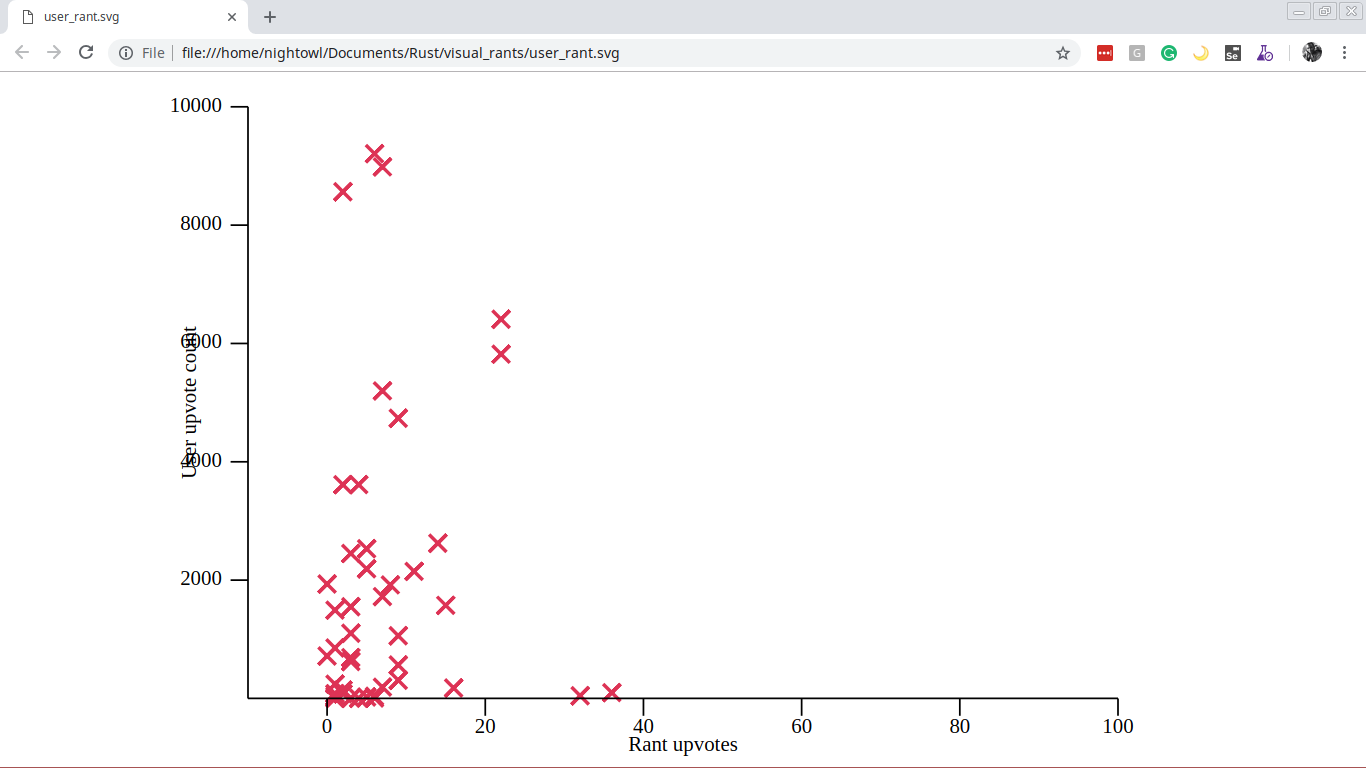
VisualRants consumes the DevRant API and generates graphs based on a rant's data.
- StructOpt - Tool to parse command line arguments, based on clap.
- Plotlib - Data plotting and rendering library
Building VisualRants requires rustup, version 1.14.0 or more recent. If you have an older version, run rustup self update
-s SORTsets how you want rants to be sorted. Possible values for sort:recent,algo,top-r RANGEsets the time period to fetch rants from. Possible values for range:day,week,month,all-l LIMITsets the number of rants to fetch--skip SKIPsets the number of rants to skip. Defaults to zero
To display help, type cargo run -- --help
The following are some example commands
cargo run -- -s algo -r day -l 50 --skip 1
cargo run -- -r month -s algo -l 20
User upvotes against number of comments on rant
User upvote count against rant upvote count
Save fetched rants to MySQL
This is provided under MIT.

