Compatible with Python 3.6, 3.7, and 3.8, 3.9
fitter package provides a simple class to identify the distribution from which a data samples is generated from. It uses 80 distributions from Scipy and allows you to plot the results to check what is the most probable distribution and the best parameters.
pip install fitter
fitter is also available on conda (bioconda channel):
conda install fitter
And as a singularity file in damona <https://damona.readthedocs.io>:
pip install damona
damona install fitter
A standalone application (very simple) is also provided and works with input CSV files:
fitter fitdist data.csv --column-number 1 --distributions gamma,normal
It creates a file called fitter.png and a log fitter.log
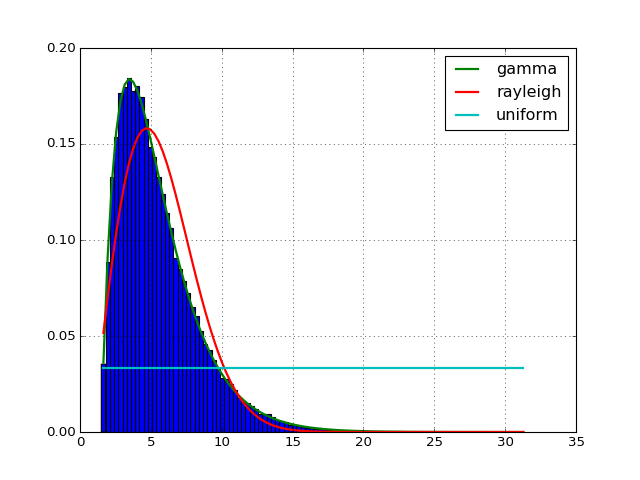
First, let us create a data samples with N = 10,000 points from a gamma distribution:
from scipy import stats
data = stats.gamma.rvs(2, loc=1.5, scale=2, size=10000)
Note
the fitting is slow so keep the size value to reasonable value.
Now, without any knowledge about the distribution or its parameter, what is the distribution that fits the data best ? Scipy has 80 distributions and the Fitter class will scan all of them, call the fit function for you, ignoring those that fail or run forever and finally give you a summary of the best distributions in the sense of sum of the square errors. The best is to give an example:
from fitter import Fitter
f = Fitter(data)
f.fit()
# may take some time since by default, all distributions are tried
# but you call manually provide a smaller set of distributions
f.summary()
See the online documentation for details.
| Version | Description |
|---|---|
| 1.4.0 |
|
| 1.3.0 |
|
| 1.2.3 |
|
| 1.2.2 | was not released |
| 1.2.1 | adding new class called histfit (see documentation) |
| 1.2 |
|
| 1.1 |
|
| 1.0.9 |
|
| 1.0.6 |
|
| 1.0.5 | https://github.com/cokelaer/fitter/issues |
| 1.0.2 | add manifest to fix missing source in the pypi repository. |