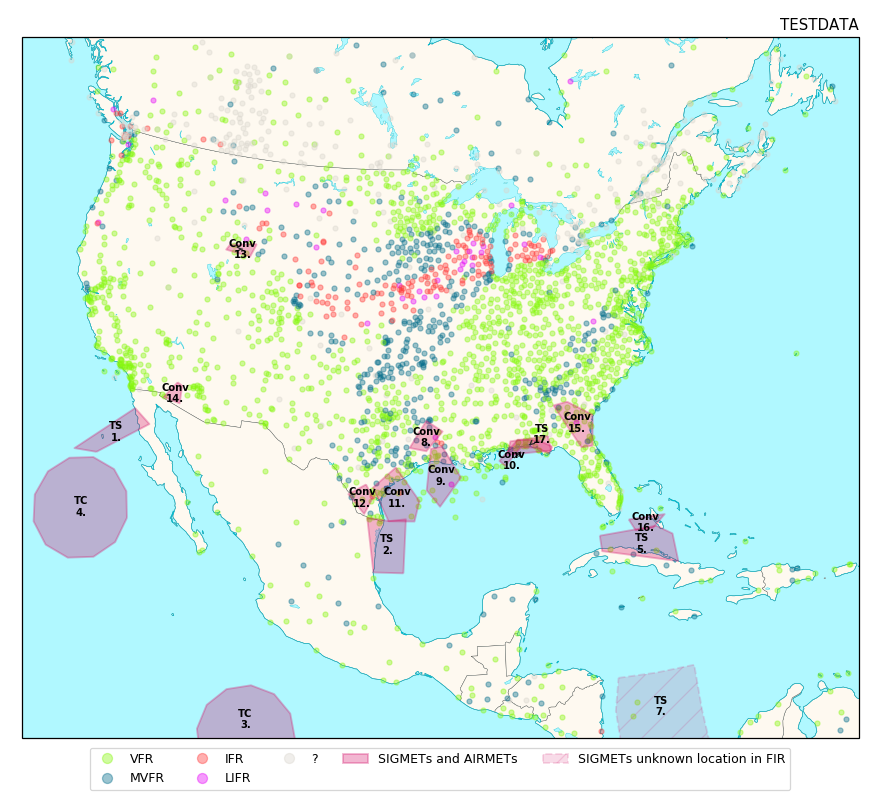
This program retrieves the US SIGMETS, US CWAs, international SIGMETS and METARs from the aviationweather.gov GeoJSON web services and plots a map containing the SIGMETs, AIRMETs and METARs fligth category received.
The map contains many features. A base map of 10m resolution containing countries, lakes, land and oceans. On top of this all METARs available for the region are plotted, colour coded for their current flight categories.
SIGMETs are added on top of this. Both polygon based and point based SIGMETs are supported. All SIGMETs which could not be correctly parsed by the aviationweather.gov webservice are shown in a lighter tone with a different border.
Cartopy is used for plotting the base map and for projecting the map data onto a matplotlib plot. This is served up by a tiny Flask webservice. Images are not included in the result of the web service call but stored in Flasks static folder.
These images are automatically deleted by a clean up process which runs every two hours.
Since testing map plotting directly would be quite labor intensive a semi-automated approach was chosen. Reference images are generated based upon the downloaded data. The downloaded data is intercepted and also serialized to json files. These reference images are used for comparison to the ones generated in the unit tests.
Specially crafted input files with expected errors can also be used for validating the behaviour of the map plotting functionality.
Whenever functionality which influences the map rendering new reference images need to be generated these reference images are then checked by hand for the expected rendering result and from there on used for unit testing.
