A Python package for plotting the positions, directions or energy distributions of OpenMC sources.
You will need to have OpenMC version 0.14.0 or newer installed first.
pip install openmc_source_plotterThe package provides three plotting functions that can plot source data from openmc objects.
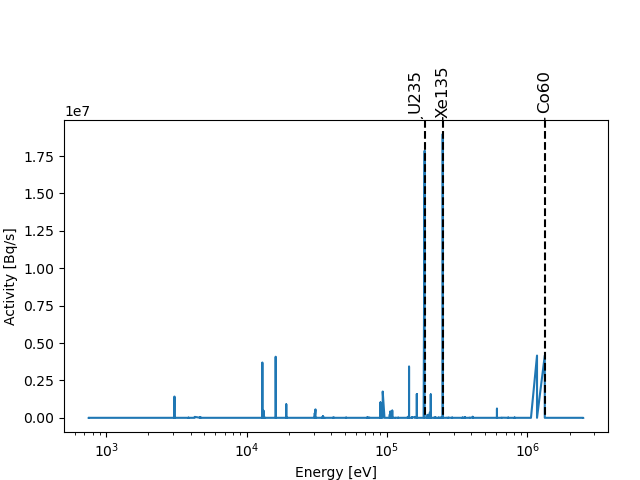
plot_source_energyplot_source_positionplot_source_directionplot_gamma_emission
Additionally the package provides a convienient method of sampling particles
sample_initial_particles
Below are some basic examples, for more examples see the examples folder for example usage scripts.
🔗Link to example script.
🔗Link to example script.
🔗Link to example script.
🔗Link to example script.
🔗Link to example script.
A list of openmc.Particle objects can be obtained using model.sample_initial_particles() or openmc.SourceBase.sample_initial_particles()
import openmc
from openmc_source_plotter import sample_initial_particles

settings = openmc.Settings()
settings.particles = 1
settings.batches = 1
my_source = openmc.IndependentSource()
my_source.energy = openmc.stats.muir(e0=14080000.0, m_rat=5.0, kt=20000.0)
settings.source = my_source
materials = openmc.Materials()
sph = openmc.Sphere(r=100, boundary_type="vacuum")
cell = openmc.Cell(region=-sph)
geometry = openmc.Geometry([cell])

model = openmc.Model(geometry, materials, settings)

particles = sample_initial_particles(this=model, n_samples=10)

print(particles)
>>>[<SourceParticle: neutron at E=1.440285e+07 eV>, <SourceParticle: neutron at E=1.397691e+07 eV>, <SourceParticle: neutron at E=1.393681e+07 eV>, <SourceParticle: neutron at E=1.470896e+07 eV>, <SourceParticle: neutron at E=1.460563e+07 eV>, <SourceParticle: neutron at E=1.420684e+07 eV>, <SourceParticle: neutron at E=1.413932e+07 eV>, <SourceParticle: neutron at E=1.412428e+07 eV>, <SourceParticle: neutron at E=1.464779e+07 eV>, <SourceParticle: neutron at E=1.391648e+07 eV>]

print(particles[0].E)
>>>1.440285e+07Tokamak sources can also be plotted using the openmc-plasma-source package


