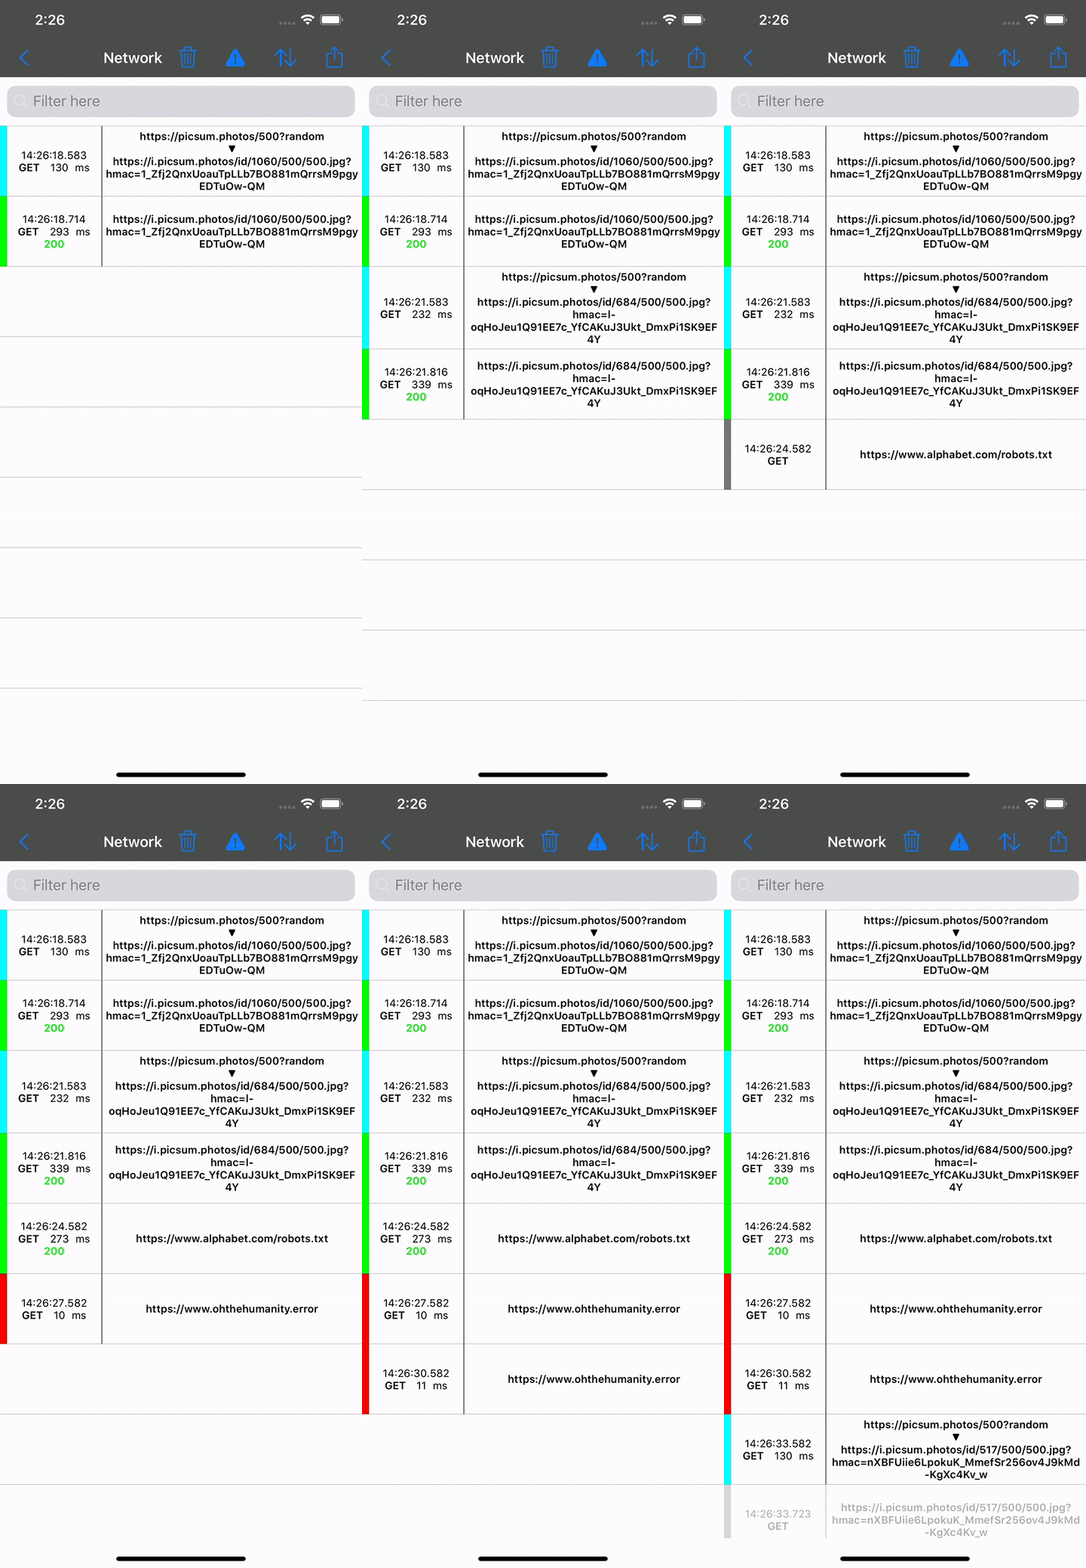
FNMNetworkMonitor is a swift iOS networking framework that can be used to monitor the network of an iOS app. It makes debugging the network easy, allowing you to pinpoint the root cause of network related problems in your app and share those requests via email. it can also mock network requests, making it much easier to use incomplete APIs or model specific states for unit testing.
Supports Swift 5 and is bridged for Obj-C compatibility.
Preview:
- Add
pod 'FNMNetworkMonitor'to yourPodfile
- Add FNMNetworkMonitor to your Apps' Swift Packages in Xcode
- Monitoring URLSession.shared:
FNMNetworkMonitor.registerToLoadingSystem()
FNMNetworkMonitor.shared.startMonitoring()- Monitoring custom URLSessions by supplying the FNMMonitor URL Protocol:
let sessionConfig = URLSessionConfiguration.ephemeral
sessionConfig.protocolClasses = FNMNetworkMonitor.normalizedURLProtocols()
self.customSession = URLSession(configuration: sessionConfig)
FNMNetworkMonitor.shared.startMonitoring()- You can also take advantage of swizzling the URLSessionConfiguration creation to configure the URL Protocol to all sessions, allowing to monitor 3rd party SDKs too.
let request = FNMProfileRequest(urlPattern: .dynamicPattern(expression: "*farfetch.*robots"))
let profiles = [FNMProfile(request: request,
                           responses: [request.response(statusCode: 200,
                                            headers: [ "Content-Type": "application/json" ],
                                            responseHolder: .keyValue(value: [ "FieldA": 1 ])
                                            delay: 0.25)])]
FNMNetworkMonitor.shared.configure(profiles: profiles)
FNMNetworkMonitor.shared.startMonitoring()
Make sure to follow steps 1, 2 or 3, depending on the URLSession that runs that particular request.
A debug UI exists that can be used for easy inspection and export of the network:
FNMNetworkMonitor.shared.showDebugListingViewController(presentingNavigationController: self.navigationController)Generally, the shake gesture is a great way to show/hide the debug view.
Also, different log levels can be applied to see how the requests are navigating through the monitor:
FNMNetworkMonitor.shared.logScope = [.export, .profile, .urlProtocol]Finally, you can turn on the passive export and the requests will be exported to a json file inside a folder found the Documents application folder.
FNMNetworkMonitor.shared.passiveExportPreference = FNMRecordExporterPreference.on(setting: .unlimited)The project contains a sample app where you can test the tool. You can run the Sample Target Scheme in NetworkMonitor.xcworkspace to see a working example of the framework.
Read the Contributing guidelines
By sending us your contributions, you are agreeing that your contribution is made subject to the terms of our Contributor Ownership Statement
List of Maintainers
The FNMNetworkMonitor is released under the MIT license. See the LICENSE file for more details.


