app-http-logger
Provide out-of-the-box automatic logging of your running docker containers, and make the data available on ElasticSearch + Kibana for further analysis and visualization.
Architecture
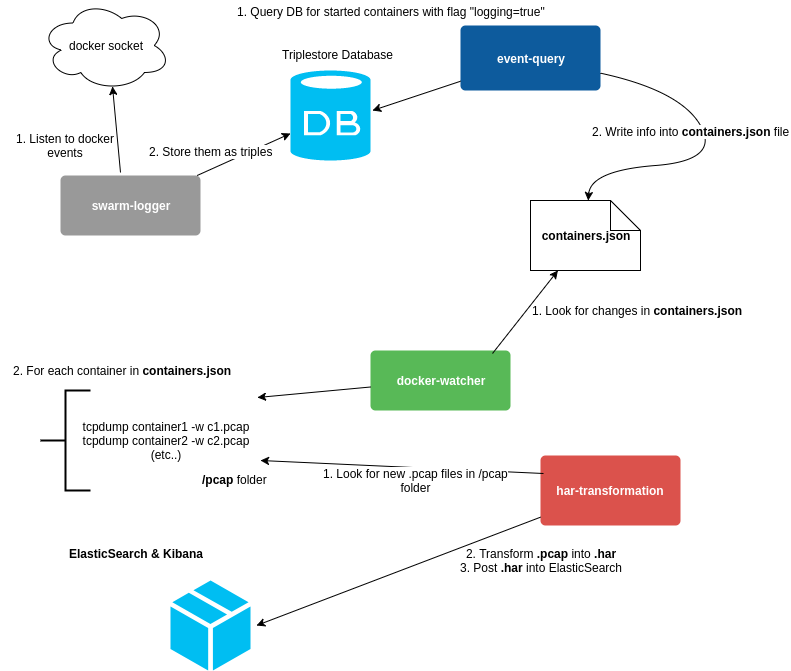
app-http-logger relies on four microservices that act as a pipeline in the data collection and discovery process.
-
mu-swarm-logger-service: observes for events in the docker socket and stores the information in a triplestore database.
-
mu-event-query-service: queries the triplestore for started containers with the "logging=true" label activated, and store the data in a JSON file.
-
mu-docker-watcher-service: looks for changes in the JSON file generated by the mu-event-query-service microservice, reflecting the addition of new running containers, and runs a new tcpdump instance per container to inspect it's network traffic and dump the data in .pcap files.
-
mu-har-transformation-service: watches the .pcap files created by the mu-docker-watcher-service microservice and transforms them into .har (json) format, enriching each file with additional data. Also, data is pushed onto an ElasticSearch instance, making it ready to be queried.

Prerequisites
- Run the app-http-logger project before any of the containers you wish to log are started. app-http-logger does not take old events into account.
- For every new started container running with the "logging=true" label, the logging platform will start observing the network traffic it generates. The following code-snippet can be added to each container in your docker-compose.yml which does HTTP network trafic.
    labels:
      - "logging=true"
Usage
- Run
docker-compose up. - After some traffic has been logged, visit http://localhost:5601, and in Kibana specify the index "har*" to start visualizing your data. This is a simple decision taken while developing the mu-har-transformation-service. Data is posted into an index called hars and an etype called har, as it can be seen in this link.
Exporting Dashboard accross ElasticSearch & Kibana instances.
Kibana offers the possibility to save & export visualizations separately or together in dashboards to later import them in different instances of the ElasticSearch & Kibana stack. It is sometimes useful to have a predefined set of visualizations to be applied to different data sets, as long as they comply with the structure and parameters they visualizations require.
Instructions on to export & import the dashboards can be found in the official documentation. Several remarks are important to be mentioned:
- In order to export a dashboard, you must export both the dashboard & each one of the individual visualizations that conform it, otherwise they won't work. Luckily there is a Export all button in Kibana.
- Visualizations are exported in JSON format, and they describe the way data is visualized, but they don't include the data itself, they will be run each time on the available data in ElasticSearch.
- Following the previous bullet point, visualizing dashboards can be applied to different datasets over time.
UPDATE TO ELASTICSEARCH 5.5!
In order to use ElasticSearch & Kibana 5 and enjoy the new UI and features, you need to update both services in docker-compose.yml:
elasticsearch:
  image: elasticsearch:5.5.0
  command: elasticsearch -E network.host=0.0.0.0
  ports:
    - "9200:9200"
kibana:
  image: kibana:5.5
  ports:
    - "5601:5601"
  environment:
    - ELASTICSEARCH_URL=http://elasticsearch:9200
  links:
    - elasticsearch:elasticsearch
In order to use ElasticSearch 5.5 you will most likely need to increase the amount of mmap counts that the operating system can make per process. Mmap counts are the amount of file descriptors that the internal Lucene engine will load into memory. Basically, the amount of files that are mapped into memory. This number is highly dependant in your operating system, and normally is quite low, so if you happen to see this error:
elasticsearch_1       | ERROR: [1] bootstrap checks failed
elasticsearch_1       | [1]: max virtual memory areas vm.max_map_count [65000] is too low, increase to at least [262144]
This command should solve it:
sudo sysctl -w vm.max_map_count=262144