sched-analyzer
BPF CO-RE based sched-analyzer
This is a personal pet project and not affiliated with any employer or organization.
It is a demonstration of how BPF can be used to extract data and store them in a manner suitable for post-processing later via pandas or similar libraries.
It hasn't been tested for robustness or verified intensively. I am particularly worried whether events can be dropped when collecting them via the BPF program.
Since we peak inside kernel internals which are not ABI, there's no guarantee this will work on every kernel. Or won't silently fail if for instance some arguments to the one of the tracepoints we attach to changes.
Goal
The BPF backend, sched-analyzer, will collect data and dump them into csv
files for post processing by any front end.
The python frontend, sched-top, examines these csv files on regular intervals
and depicts these info on the terminal.
This is the not the most efficient manner but the simplest to demonstrate what can be done.
You can run sched-analyzer alone to collect data during an experiment and
inspect the csv files with your own custom scripts afterwards.
Feel free to fork this to make it your own or contribute patches to make it better :-)
A C based front end can be done and will be more efficient. Or a python based front-end that shows interactive plots where one can zoom into any points of interest or switch views on the fly.
Data collected
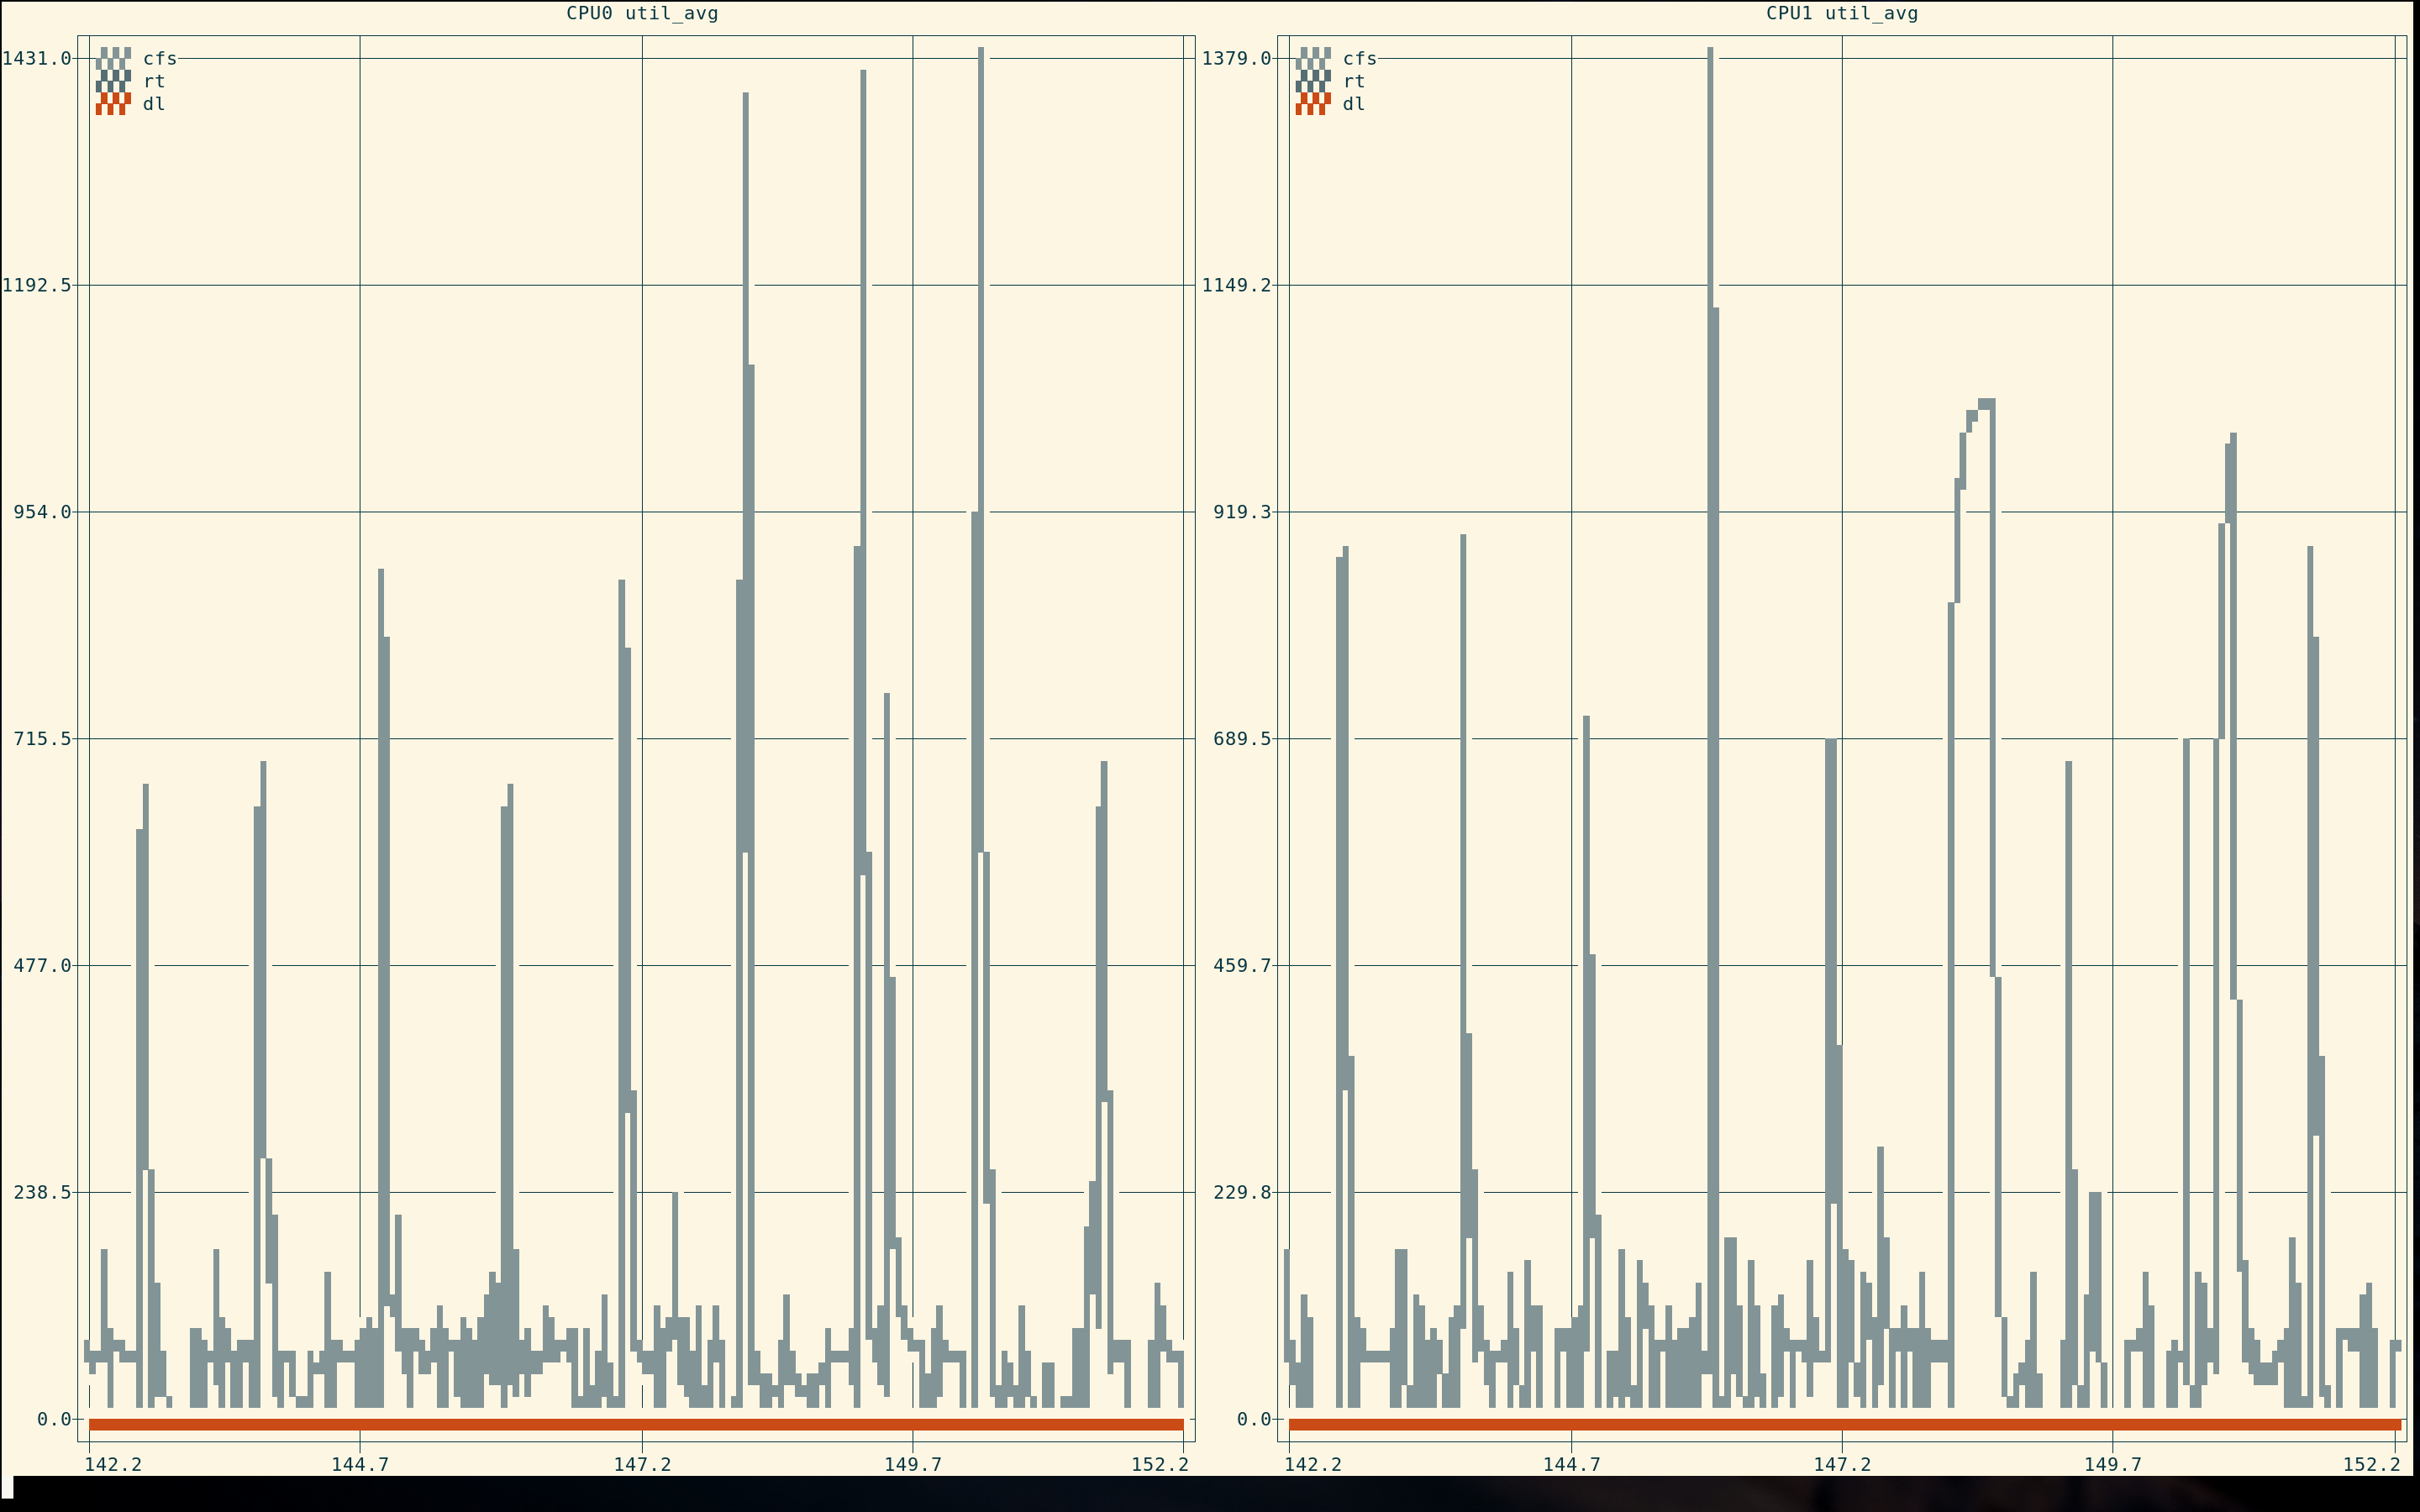
util_avg of CFS, RT and DL at runqueue level
You can find the data in /tmp/rq_pelt.csv
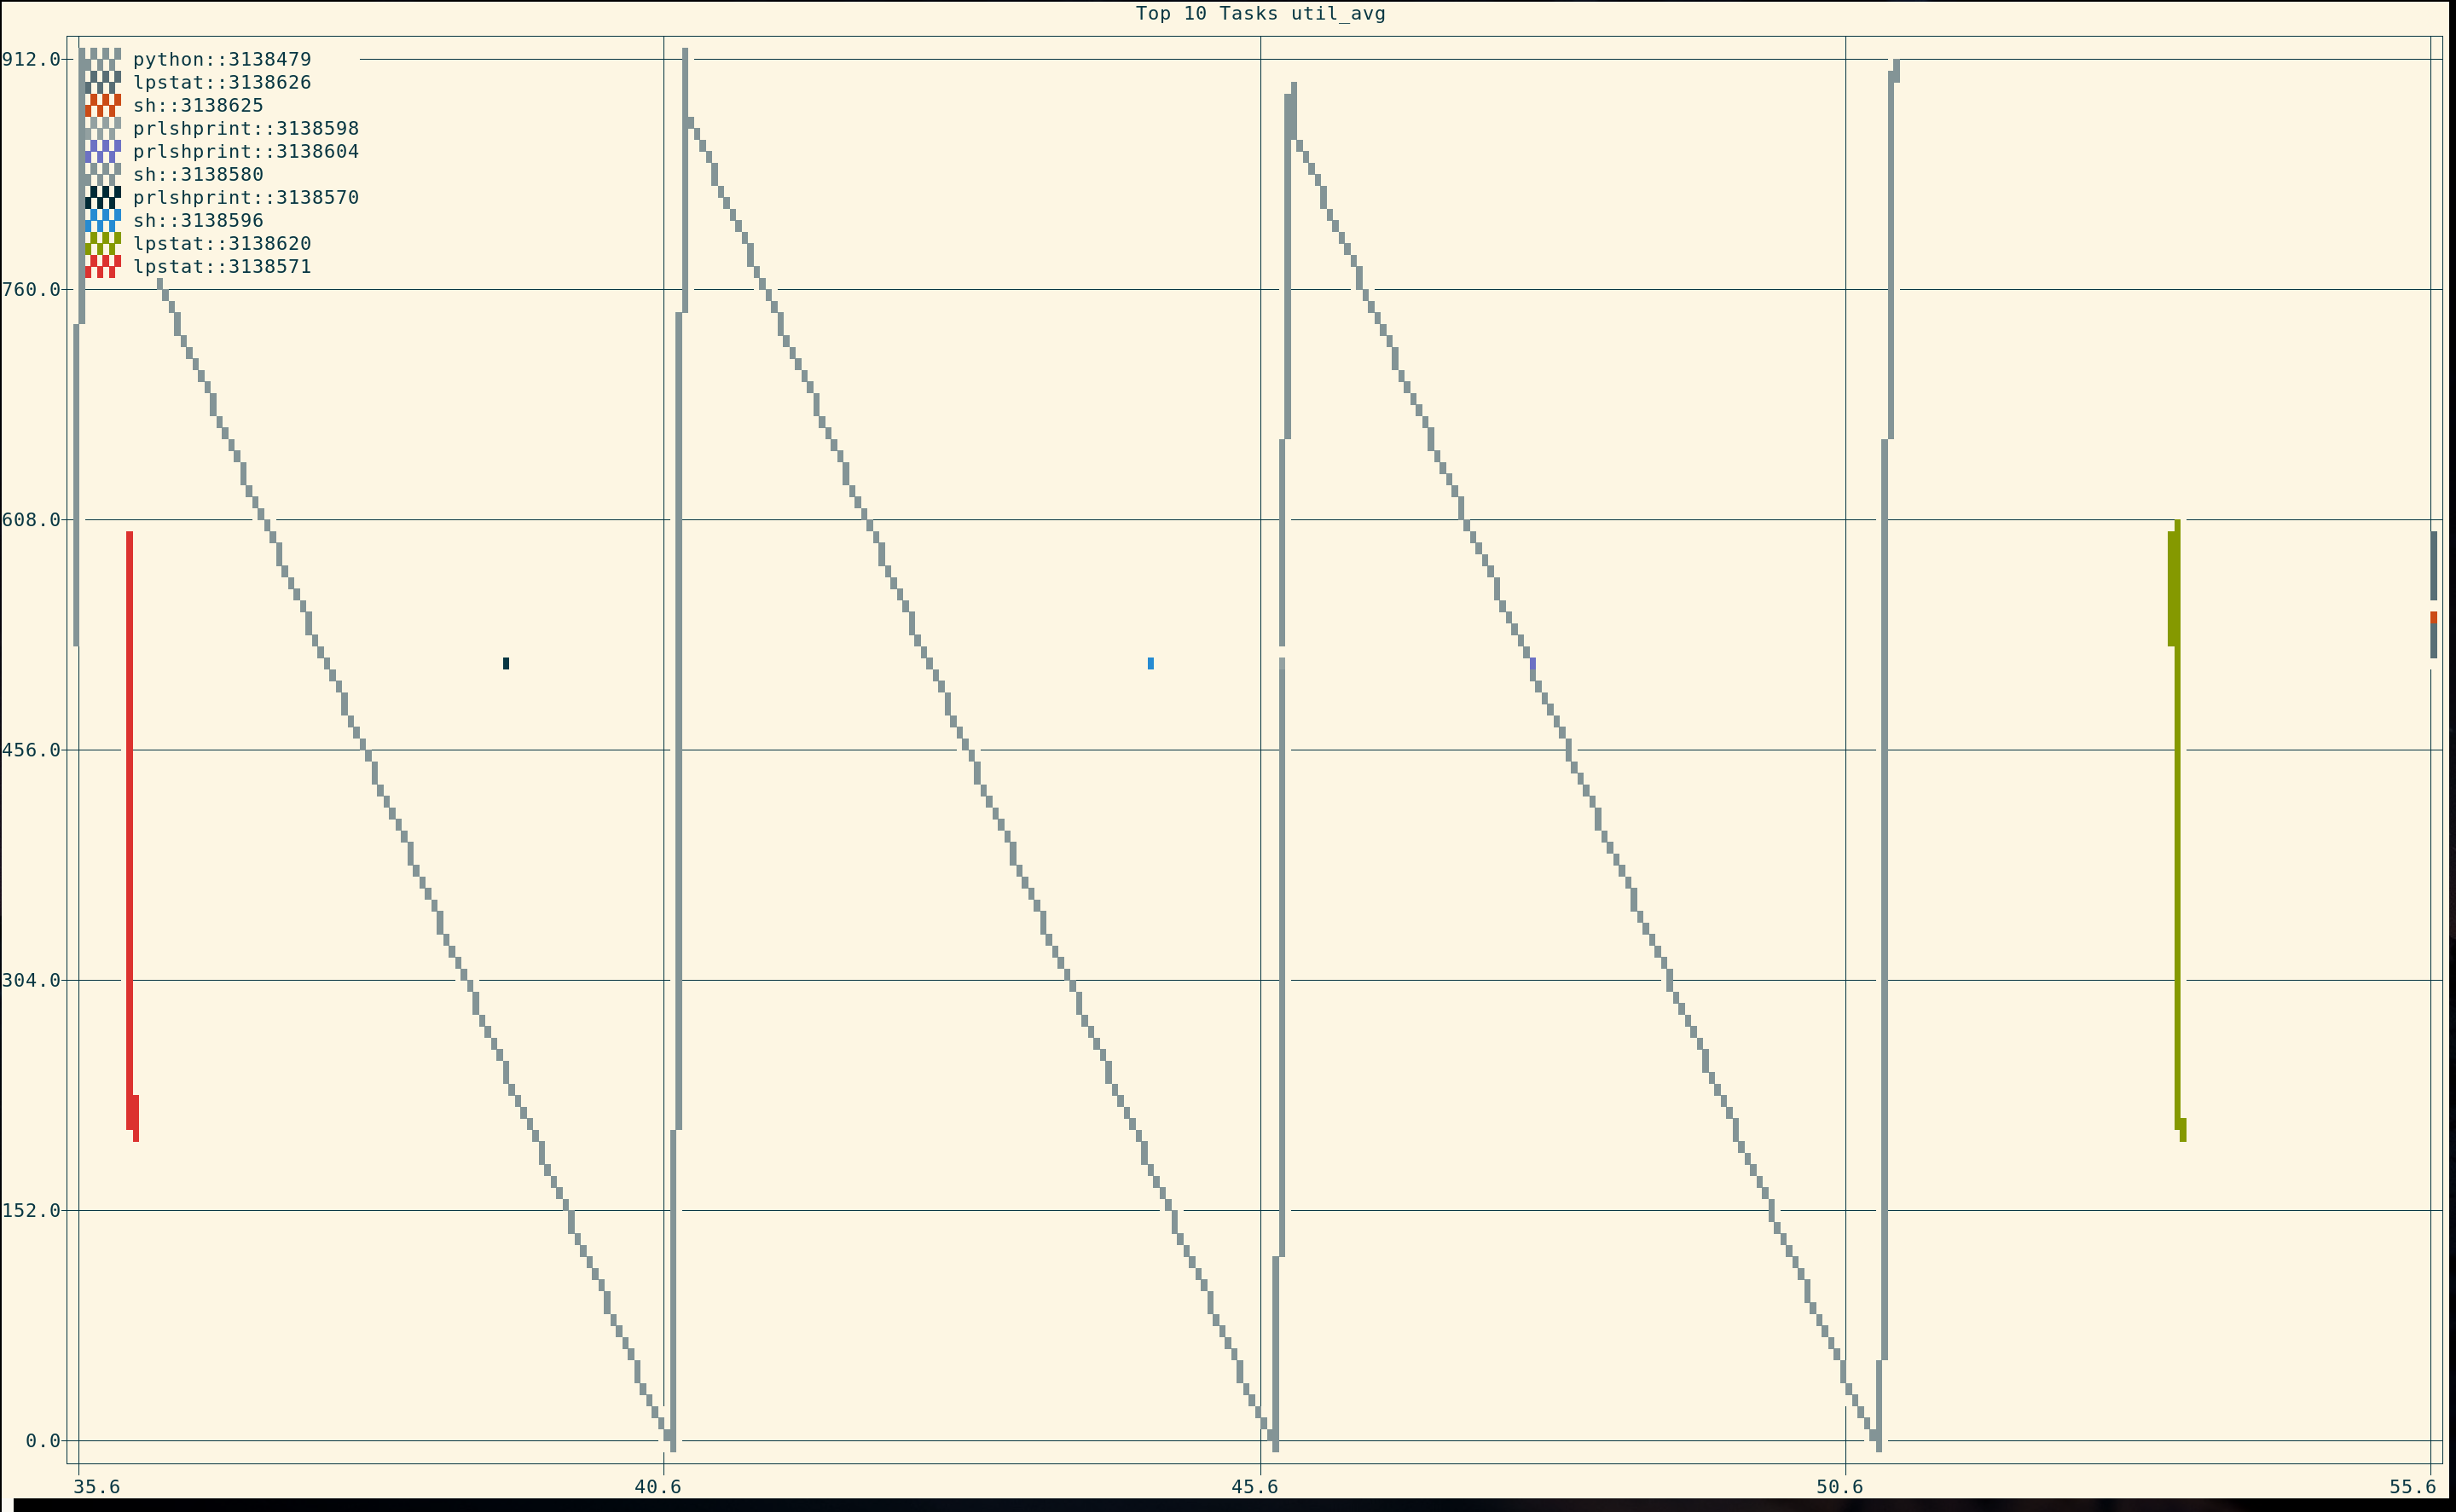
util_avg of tasks running
You can find the data in /tmp/task_pelt.csv
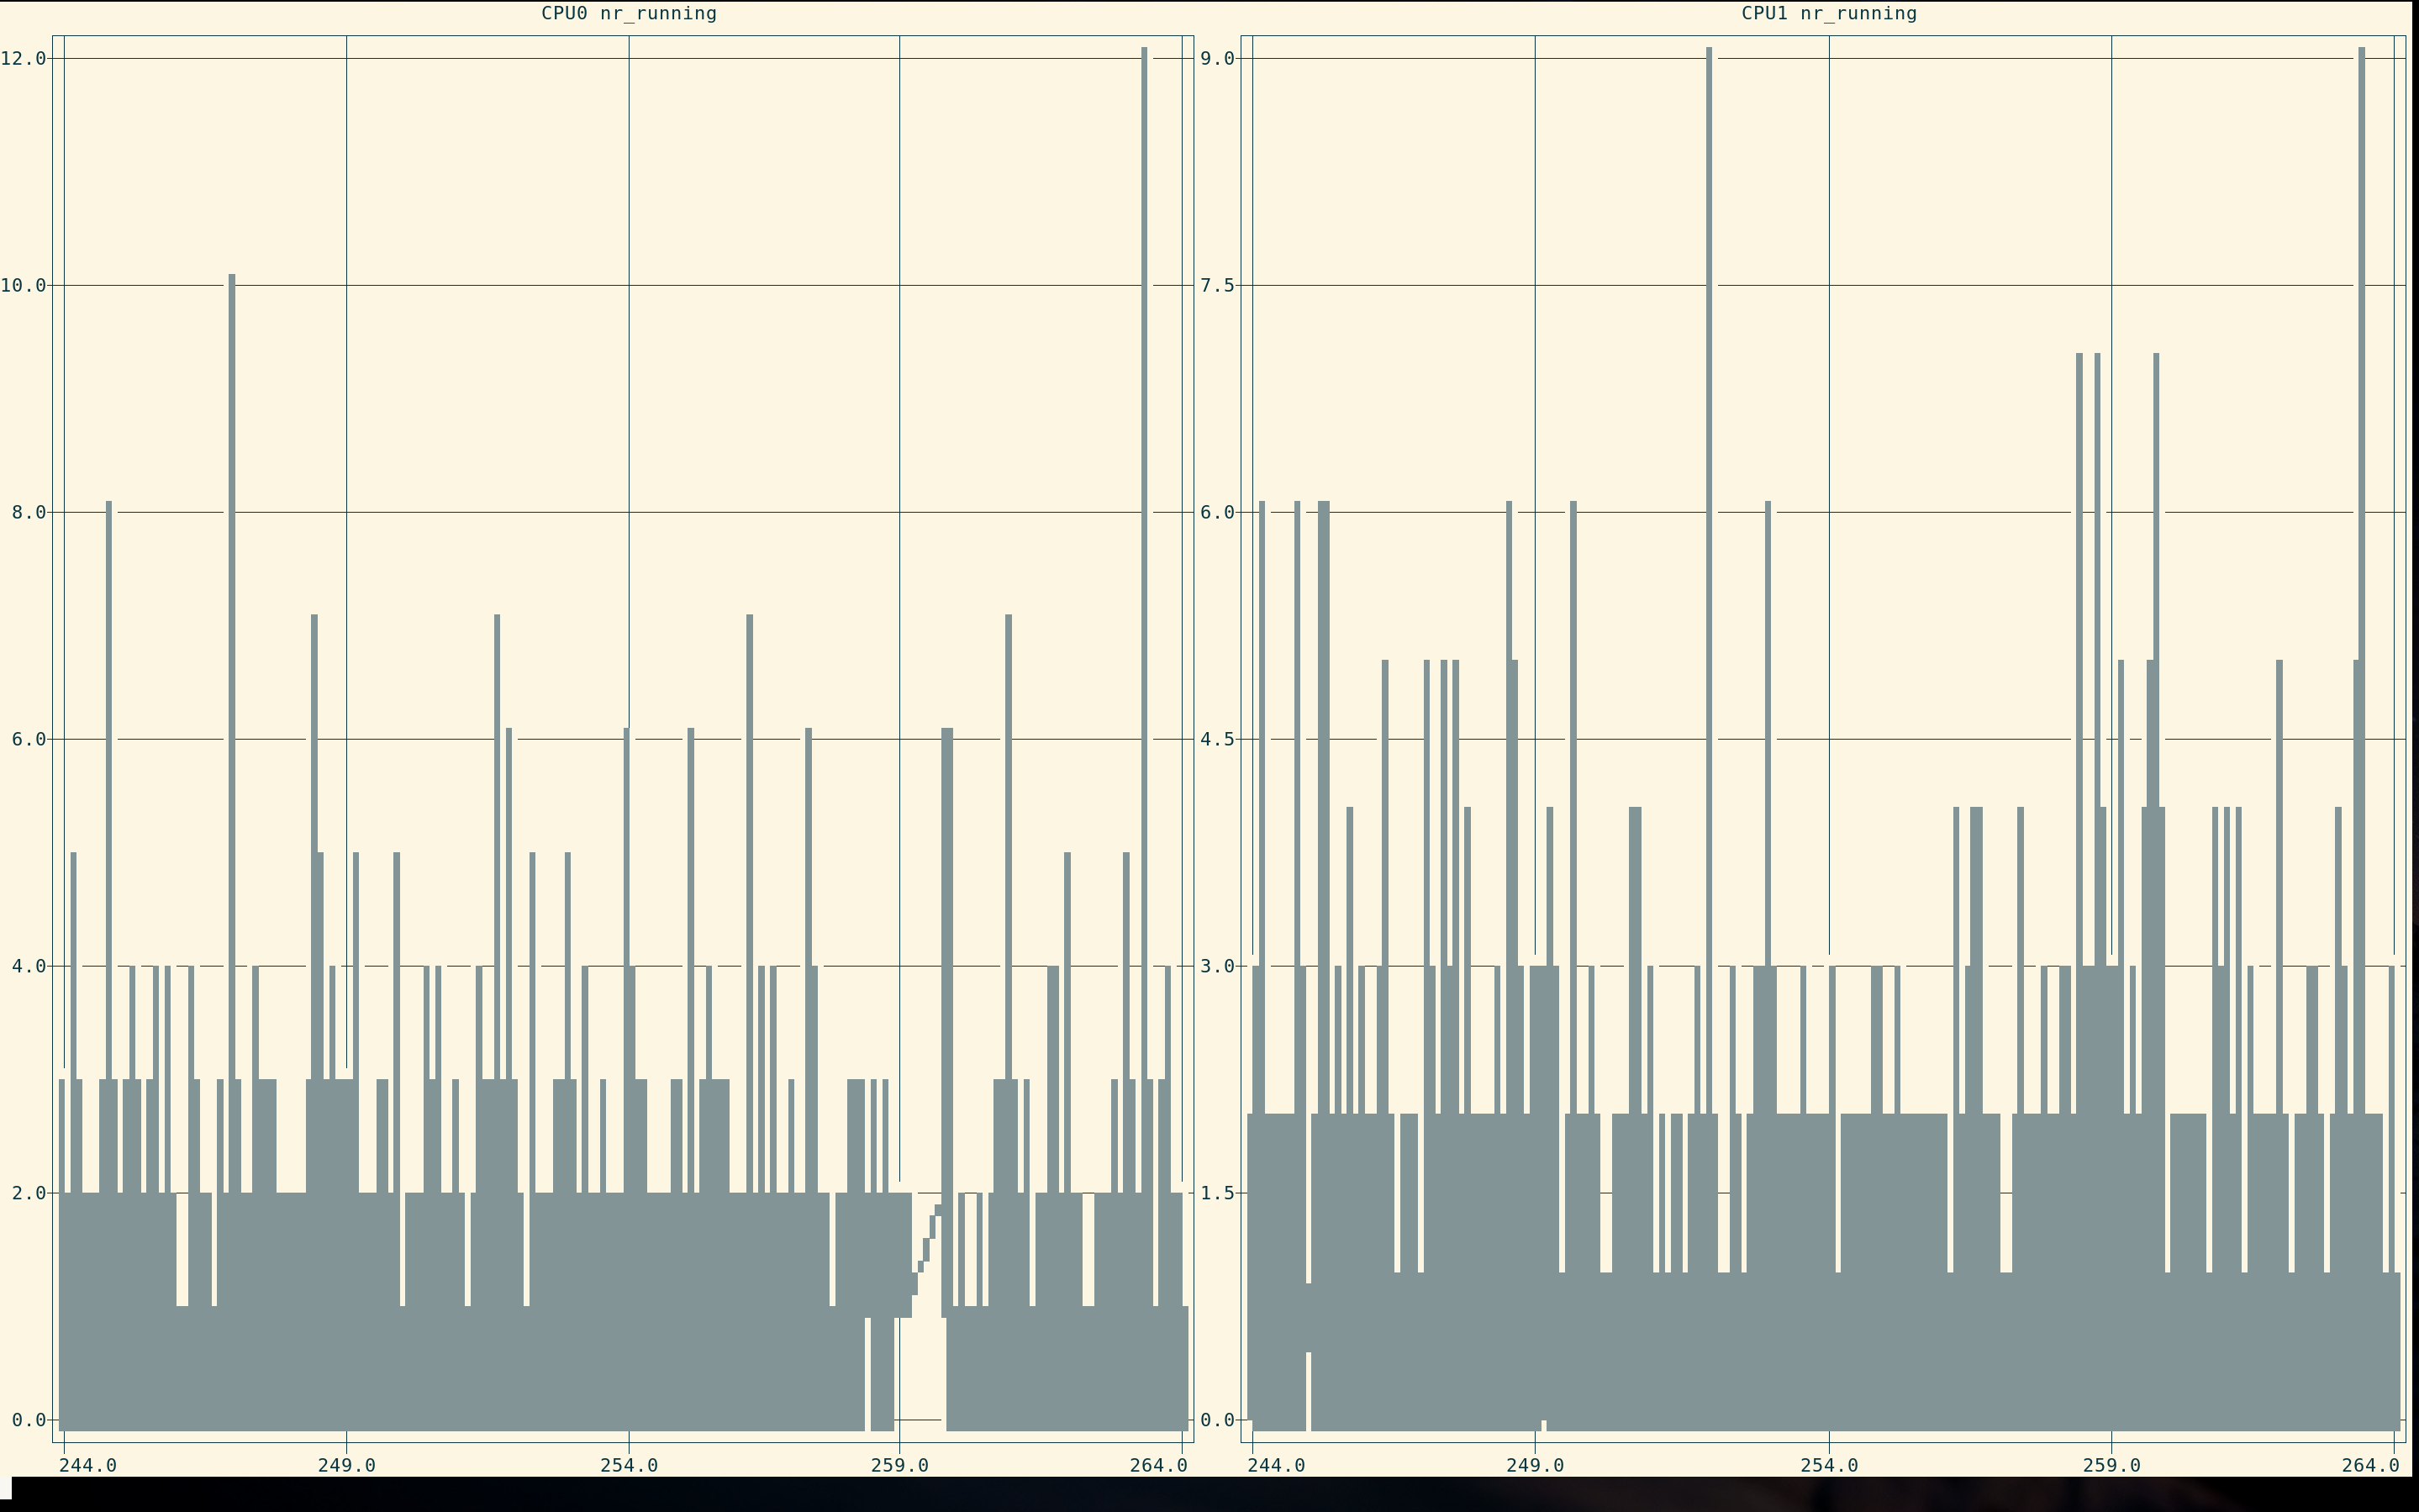
Number of tasks running for every runqueue
You can find the data in /tmp/rq_nr_running.csv
Frequency an idle states
You can find the data in /tmp/freq_idle.csv
Softirq entry and duration
You can find the data in /tmp/softirq.csv
Requirements
sudo apt install linux-tools-$(uname -r) git clang llvm libelf1 zlib1g

pip install -r requirements.txt
Setup autocomplete for options
activate-global-python-argcomplete --user
complete -r sched-top
You might need to add the following to your ~/.bash_completion to get it to work:
for file in ~/.bash_completion.d/*
do
	. $file
done
BTF
You need a kernel compiled with BTF to Compile and Run.
Required kernel config to get BTF:
- CONFIG_DEBUG_INFO_BTF=y
Build
make
Usage
sched-analyzer
sudo ./sched-analyzer
Press CTRL+c to stop. Or CTRL+z followed by bg to keep running in
background - sudo pkill -9 sched-analyzer to force kill it when done.
Warnings
Don't run more than one instance!
And don't keep it running as there are no checks on file size and we could end up eating the disk space if left running for a long time.
sched-top
While sched-analyzer is running
./sched-top
By default we show the util_avg of the top 10 busiest tasks every 5 seconds.
./sched-top --rq 2 10
Display the util_avg of CFS, RT and DL every 2 seconds, showing the last 10 seconds of information at a time.
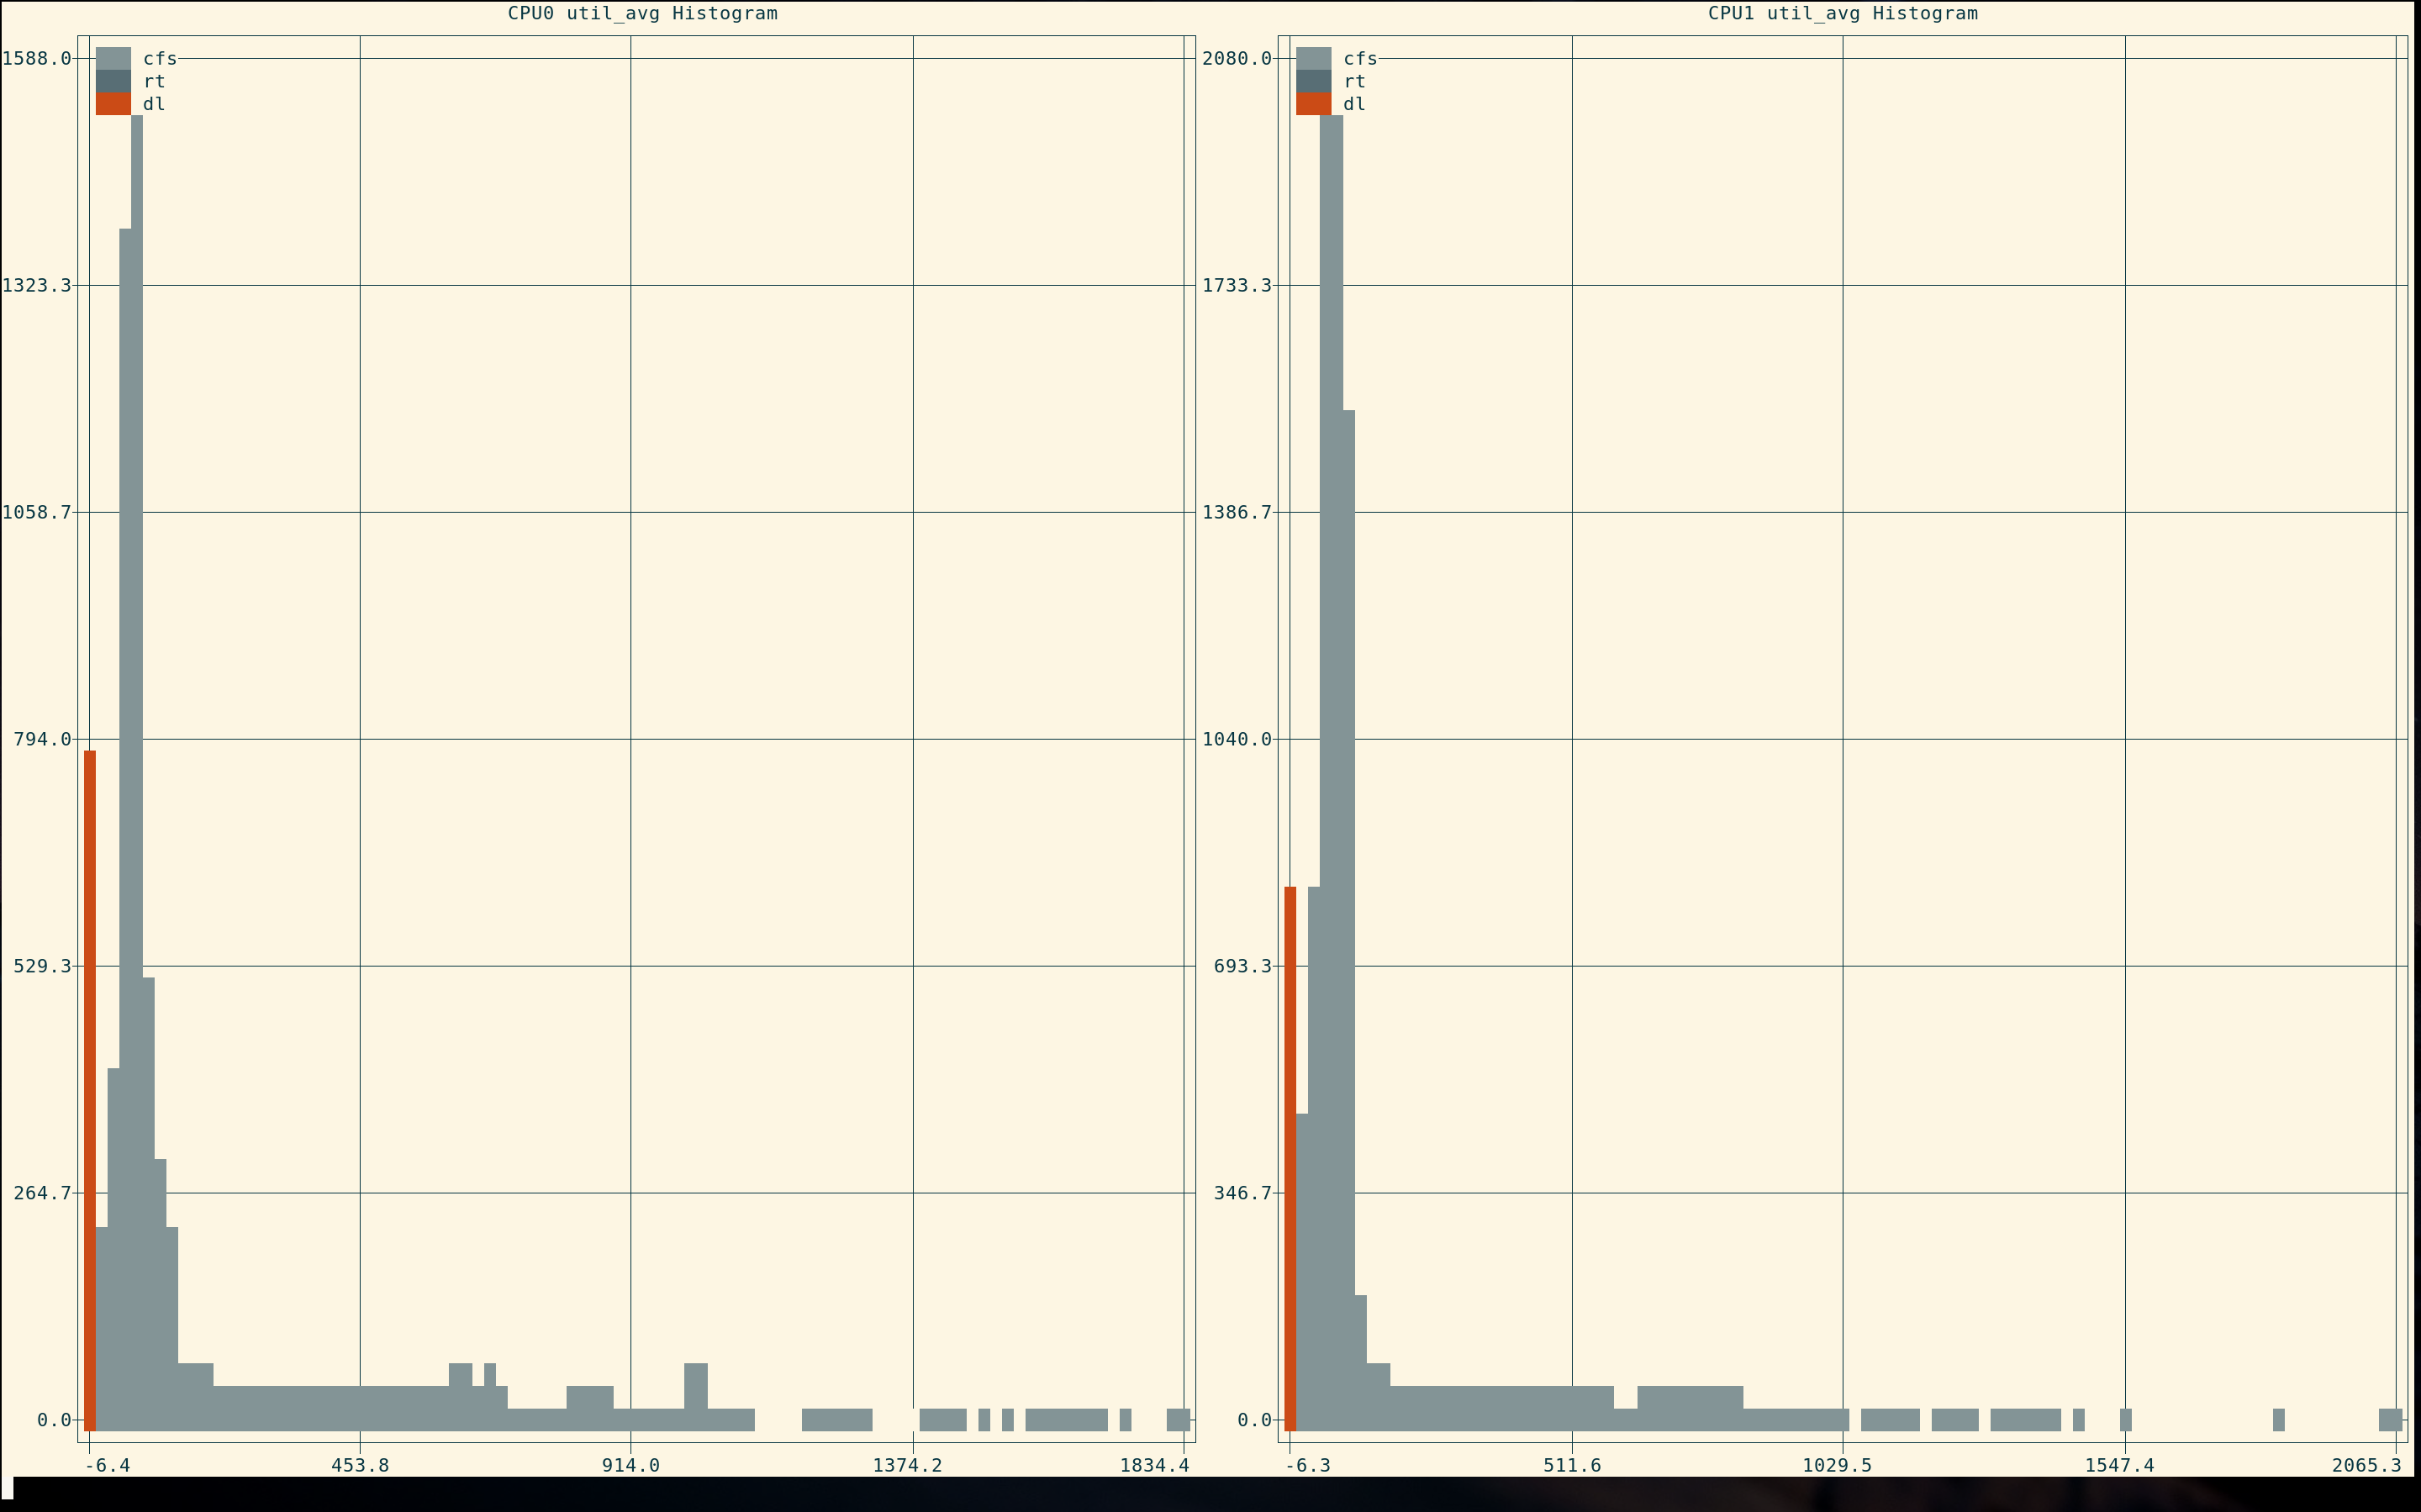
./sched-top --rq_hist 2 10
Same as above but shows a histogram.
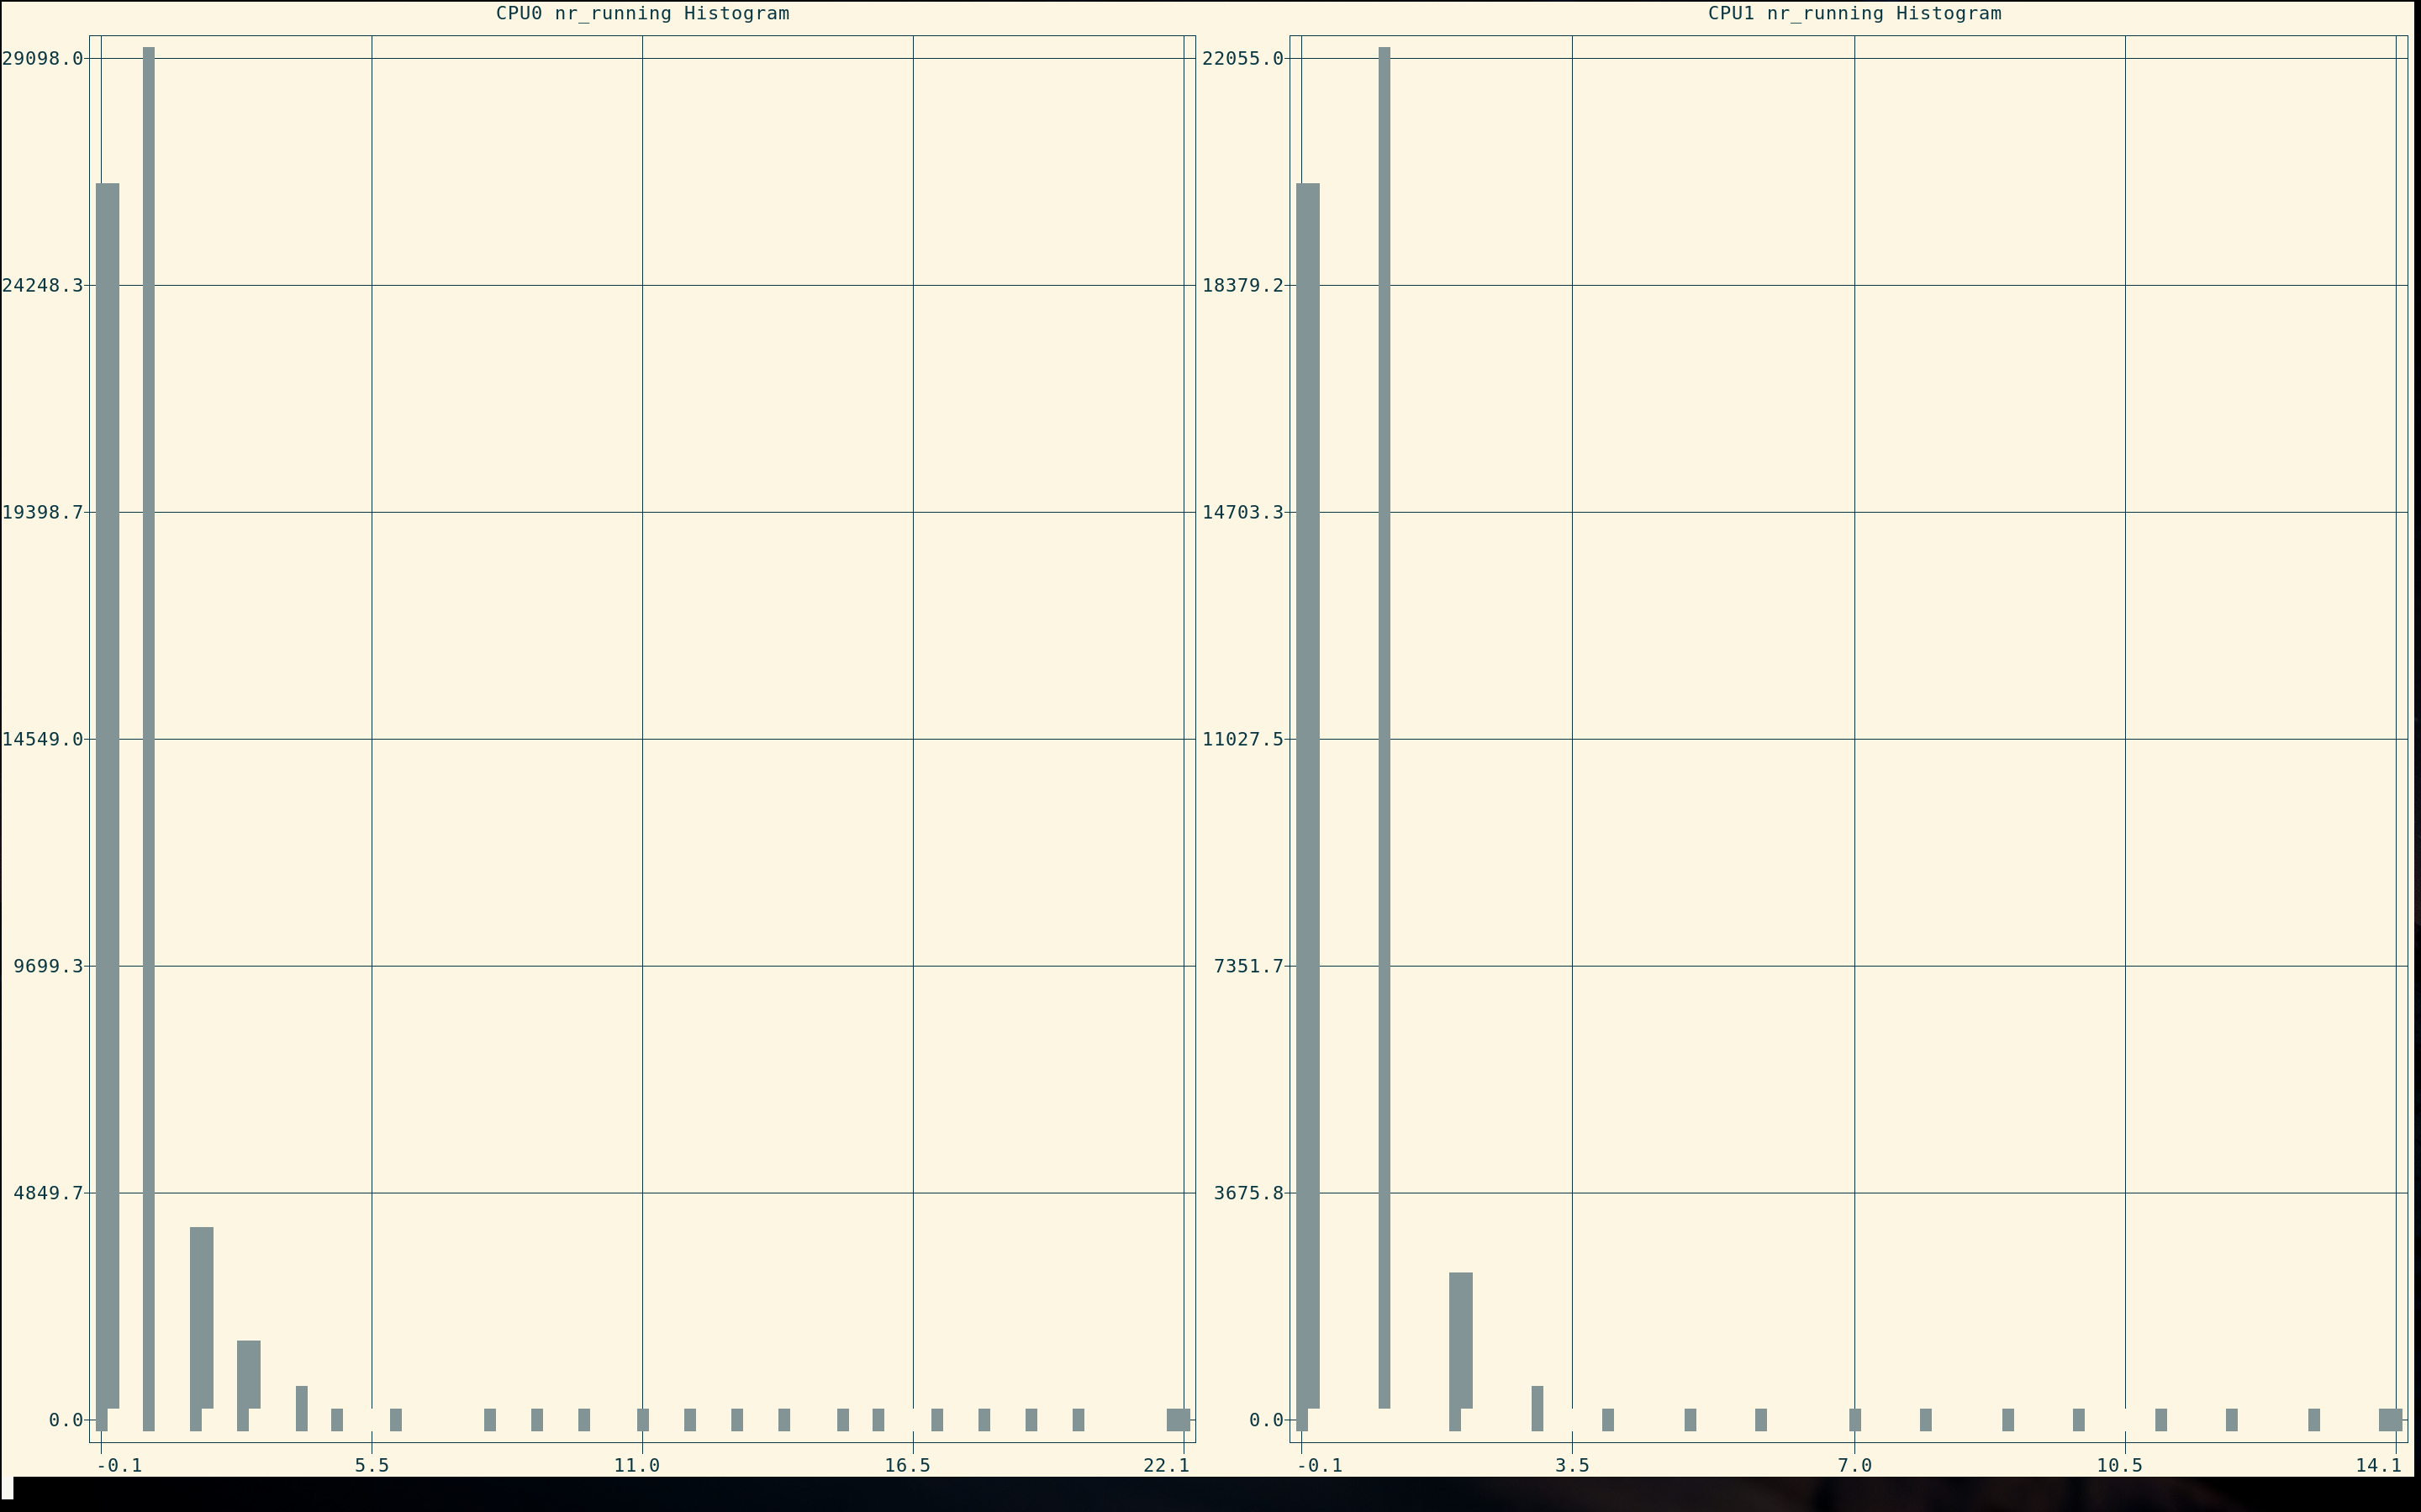
./sched-top --nr_running
Show nr_running for each runqueue every 5 seconds, displaying the last 20 seconds at a time.
./sched-top --nr_running_hist
Same as above but shows a histogram.
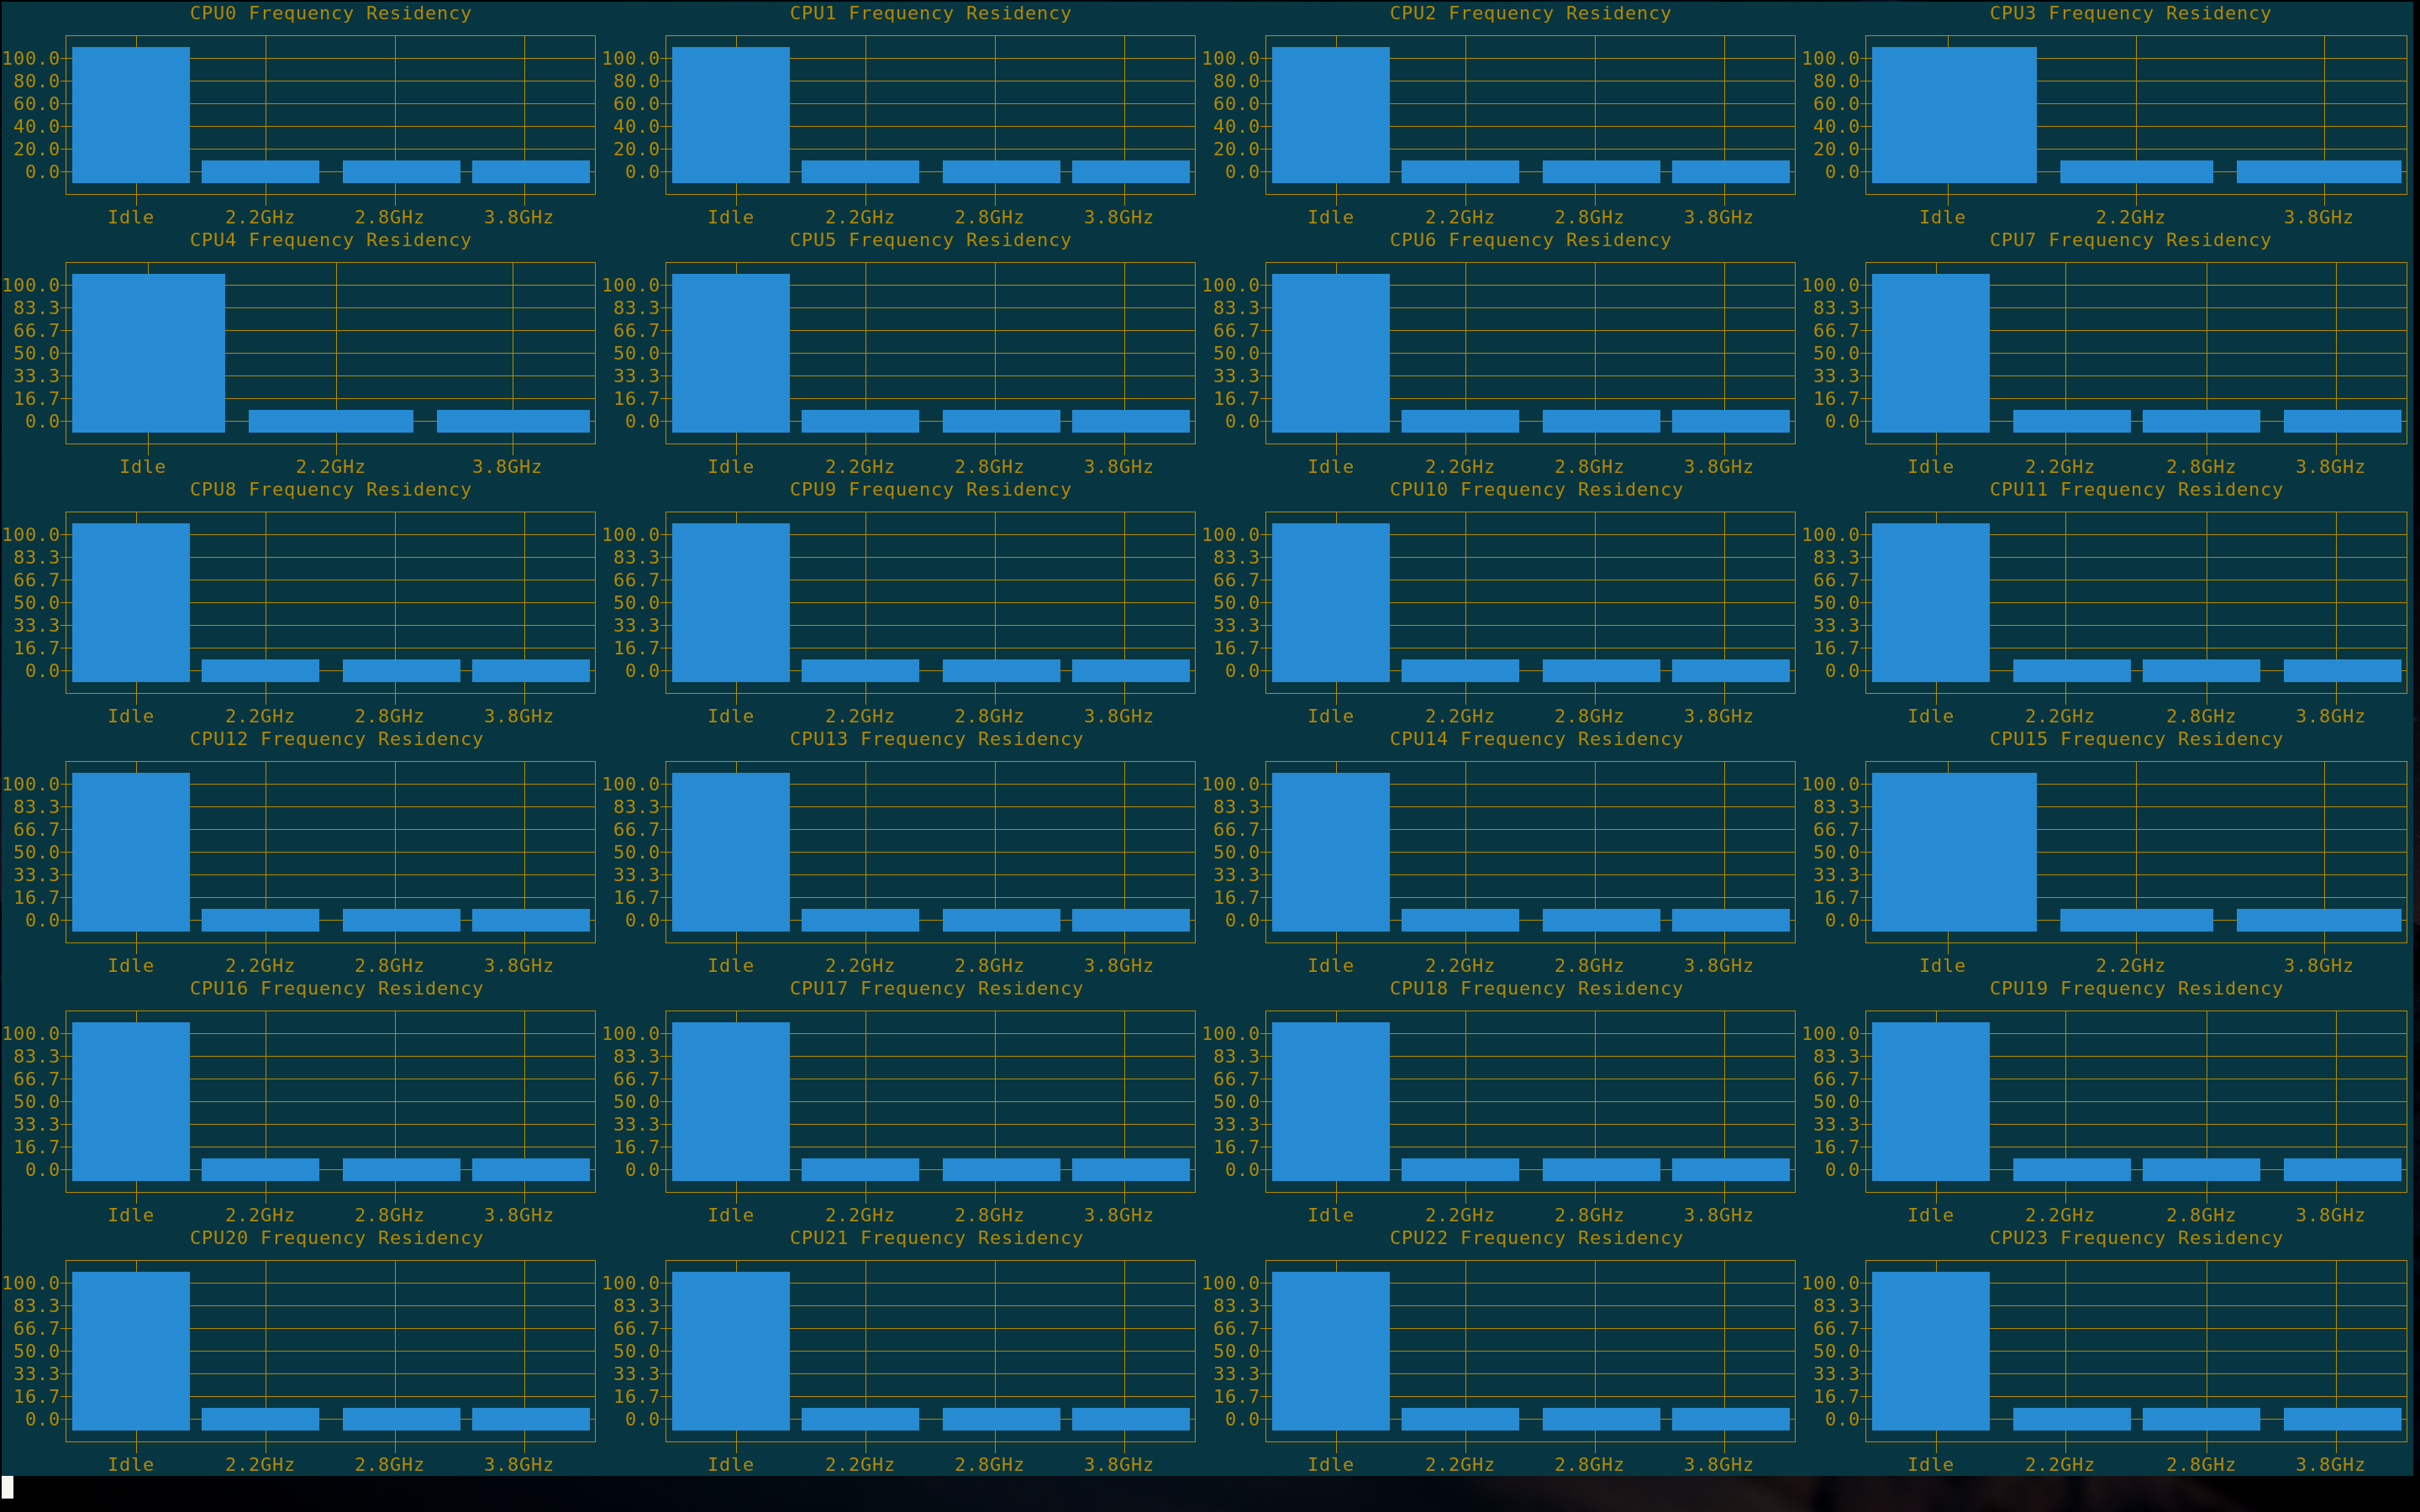
./sched-top --freq_residency 10 60 --theme dark
Show percentage of time spent in each frequency over the last 60 seconds refreshing every 10 seconds. Use dark color theme.
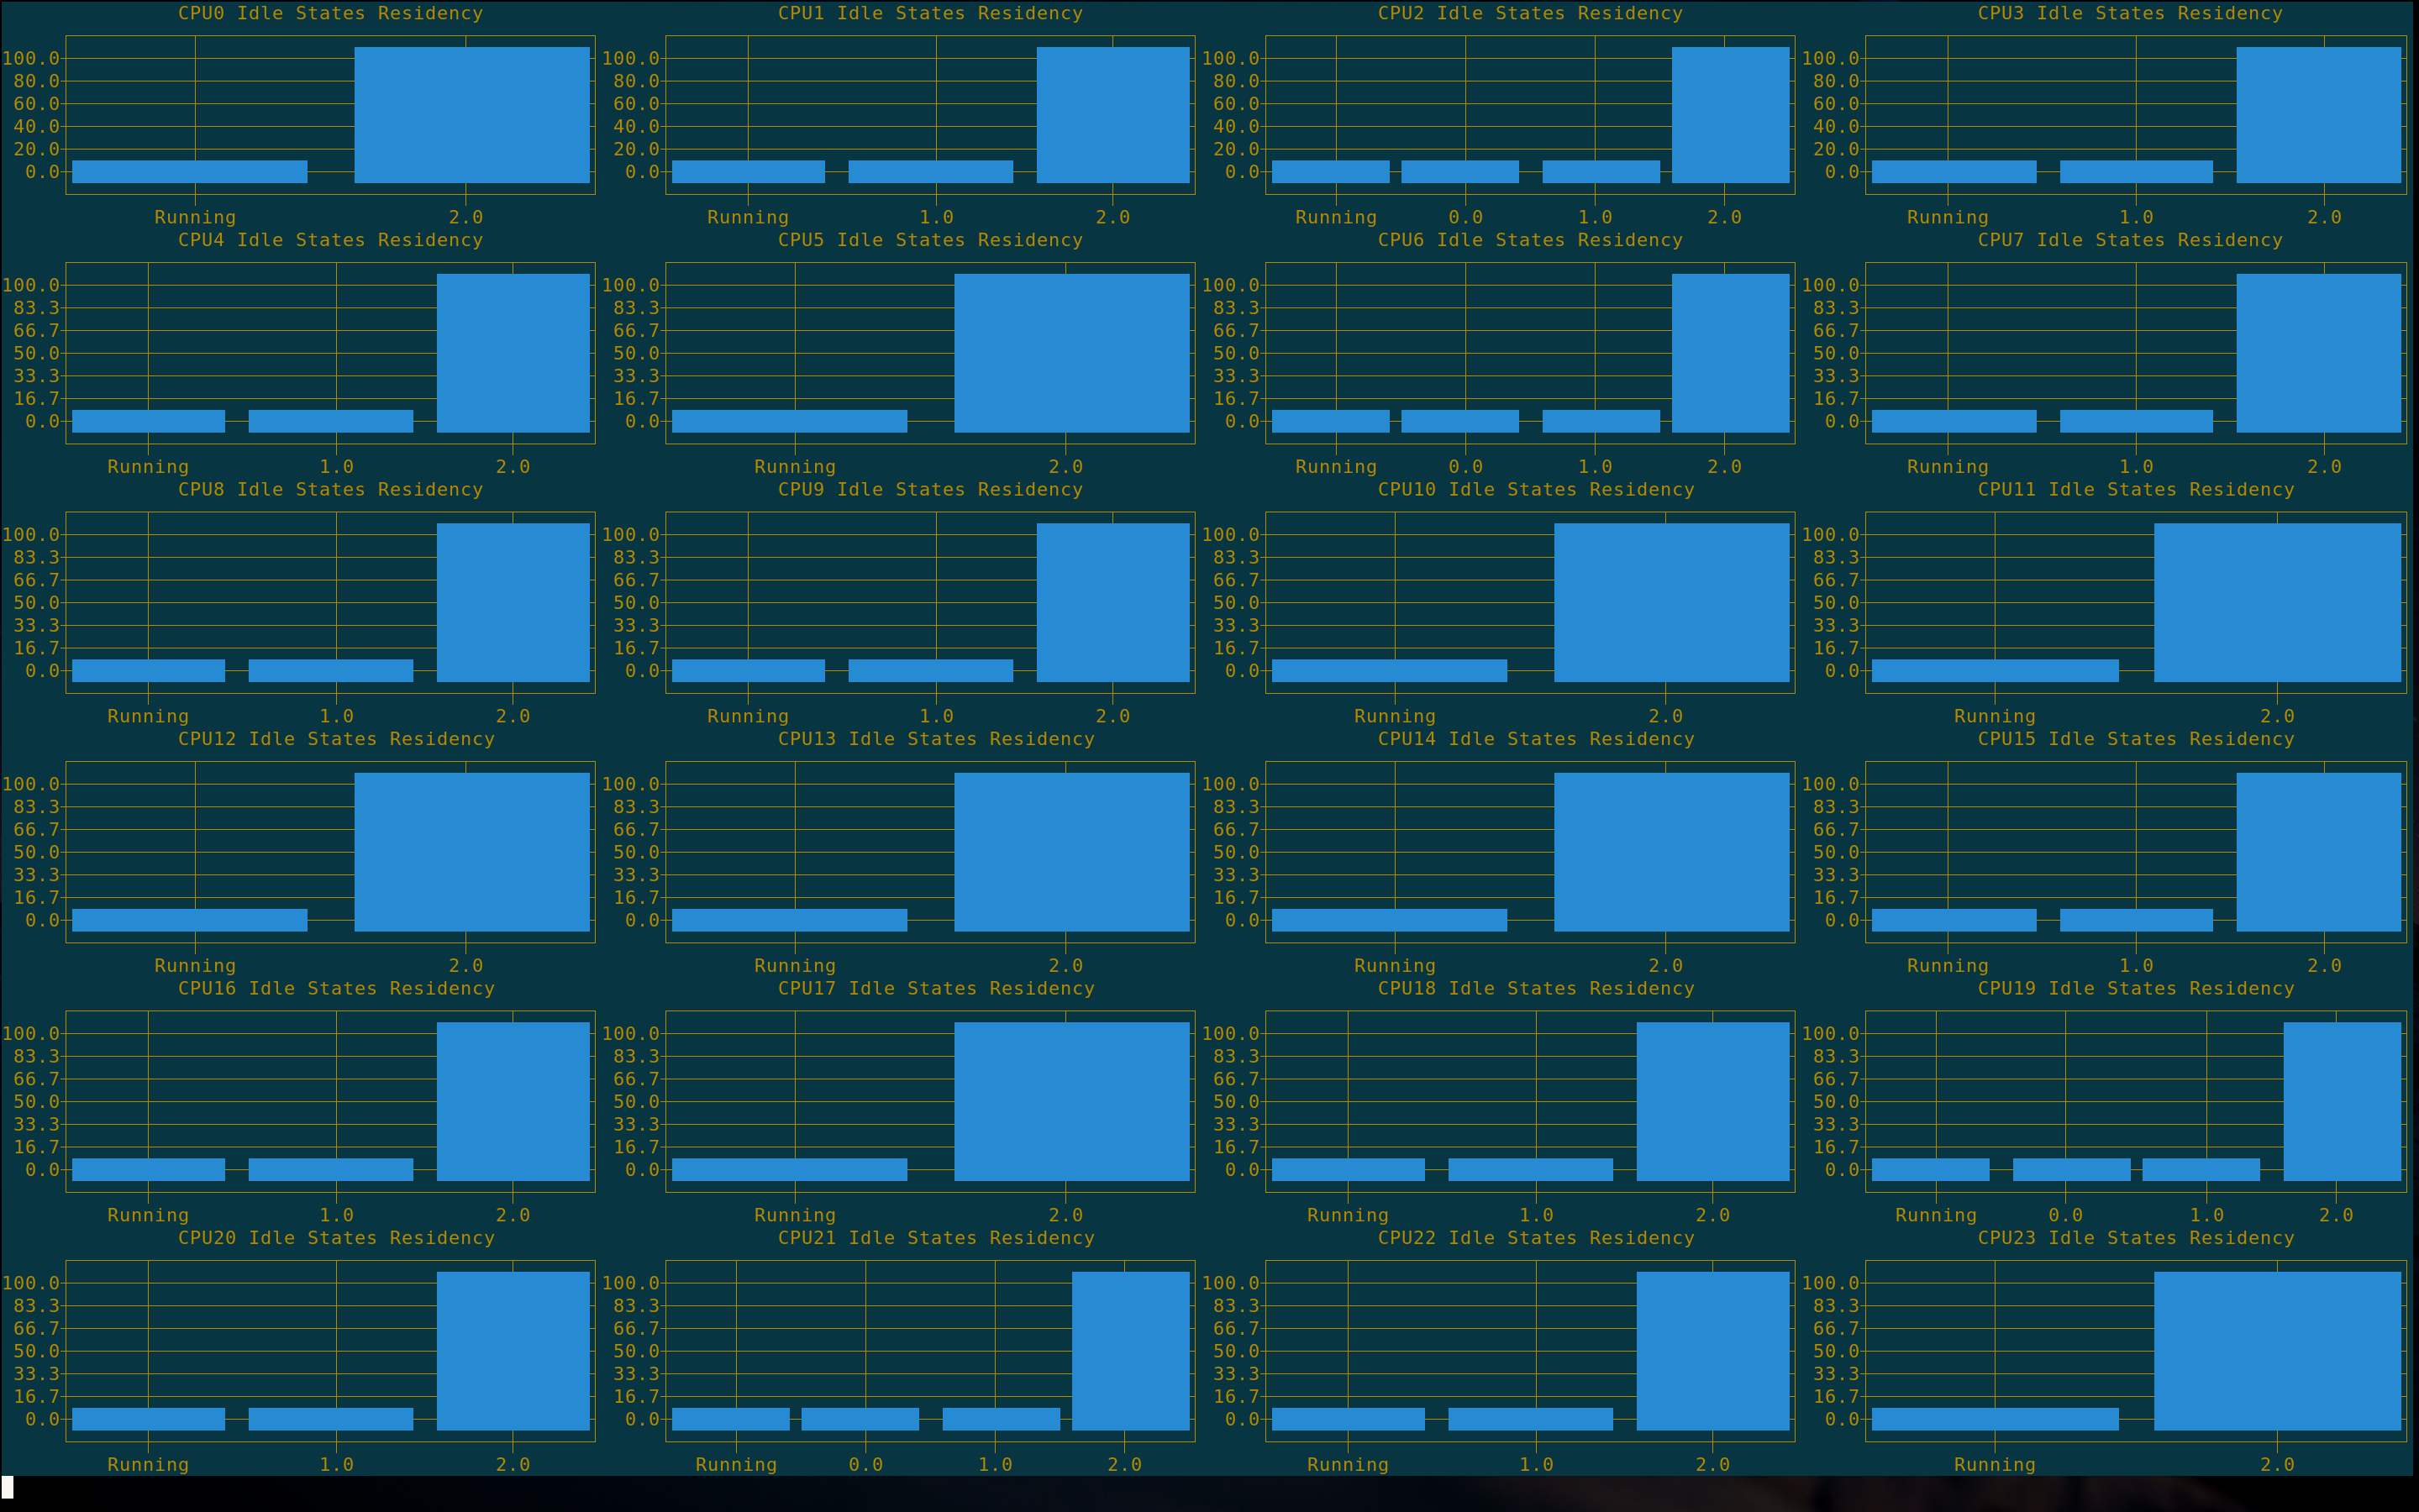
./sched-top --idle_residency 1 5 --theme dark
Show percentage of time spent in each idle state over the last 5 seconds refreshing every 1 second. Use dark color theme.
./sched-top -h
For list of all available options.
