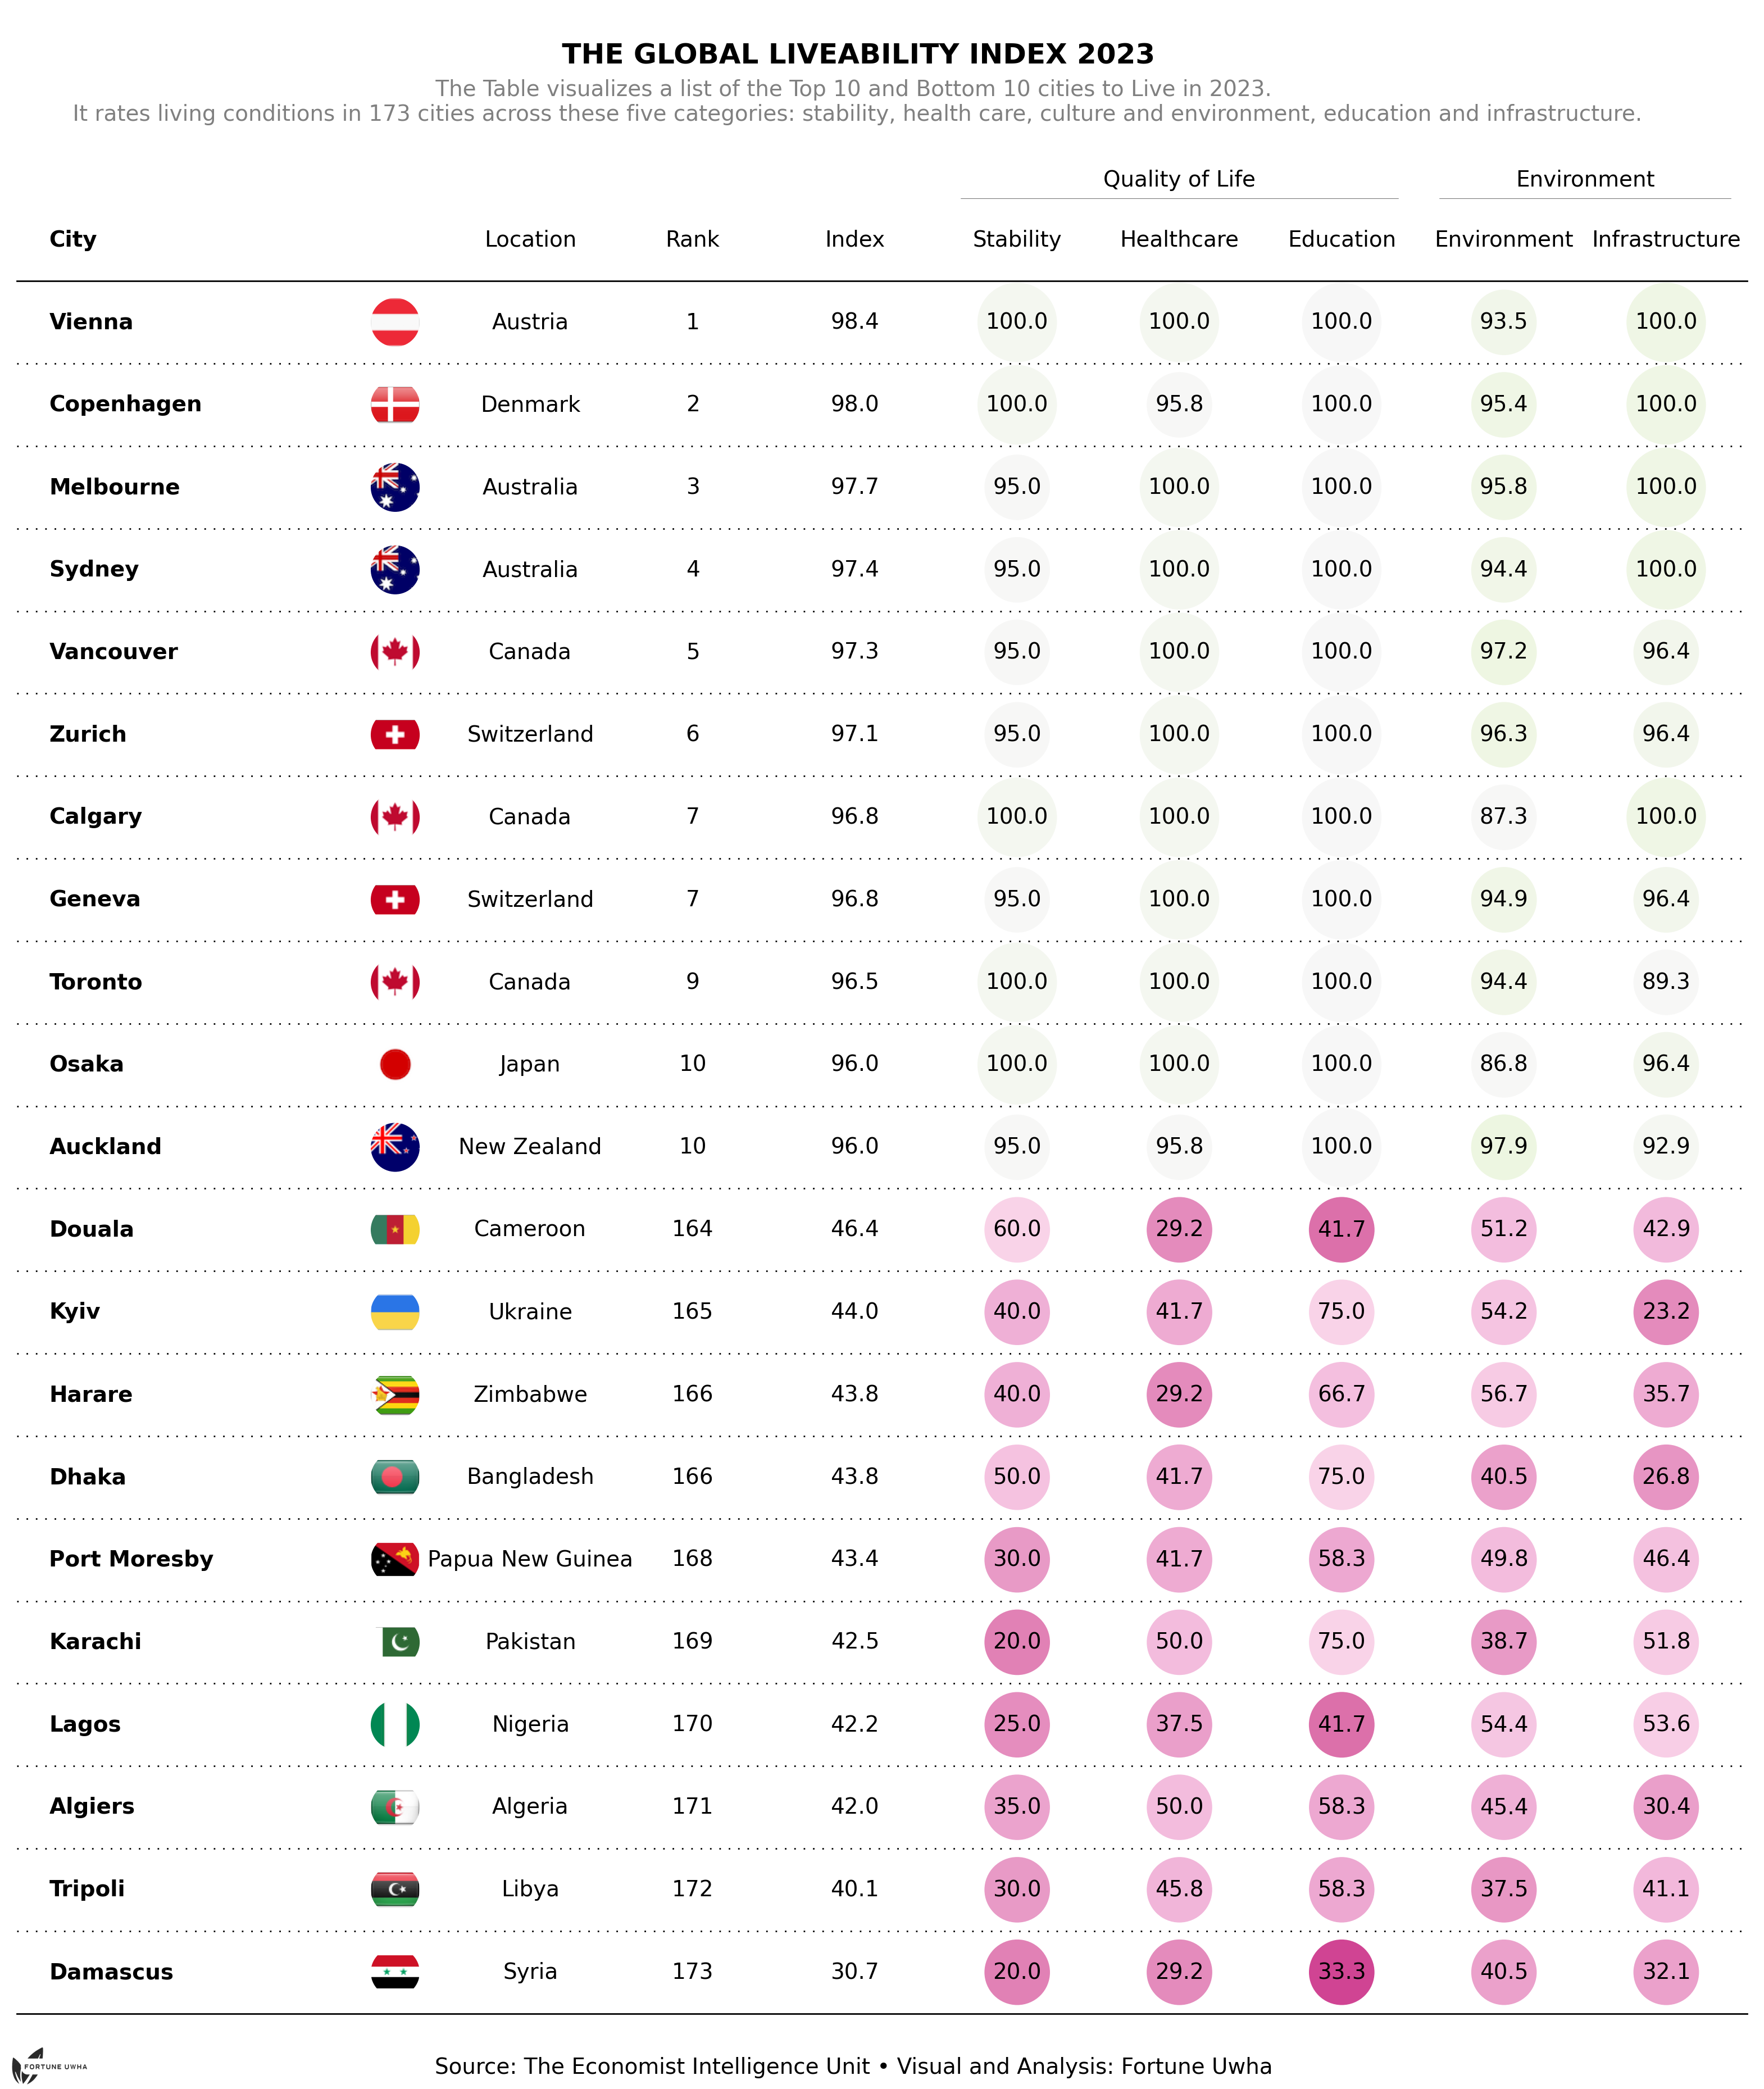
Global livability Index-2023: The findings of the latest liveability survey: optimism amid instability
- Project Overview
- Getting Started
- Dependencies
- Data
- Dashboard
- Usage
- Acknowledgement
- Contributing
- License
The goal of this project is to provide insights and visualization based on the the Top 10 and Bottom 10 cities to Live in 2023 by the Economist Intelligence Unit(EIU). It rates living conditions in 173 cities across these five categories: stability, health care, culture and environment, education and infrastructure.
To get started with the project, follow these steps:
- Clone the repository to your local machine.
- Install the required dependencies (see the Dependencies section for details).
- Get the EIU dataset for Global liveable cities (see the Data section for details).
- Run the project script or notebook to generate visualization and explore the data.
The project relies on the following dependencies:
- Python 3
- Pandas
- Plottable
The dataset used in this project is obtained from the Economist Intelligence Unit released 2023 report on global liveability index. It rates living conditions in 173 cities across five categories: stability, health care, culture and environment, education and infrastructure. You can get the dataset here.
Once you have the dataset, update the file path in the project script or notebook accordingly.
To use the project, follow these steps:
- Ensure you have the required dependencies installed (see the Dependencies section).
- Make sure you have obtained the Airbnb dataset (see the Data section).
- Run the project script or notebook using Python.
- View the visualization and adjust to analyze different aspects of the data.
This project was inspired by the work and ideas of the plottable library. View documentation here
Contributions to this project are welcome! If you find any issues or have suggestions for improvements, feel free to open an issue or submit a pull request.
This project is licensed under the MIT License.
