Nginx Geo MetricsReporter
Simple metrcis reporter with Python for track visitors' location and where connected to Nginx webservice.
https://eternalhost.net/blog/razrabotka/kubernetes-chto-eto
https://kubernetes.io/ru/docs/reference/kubectl/cheatsheet/
https://kubernetes.io/ru/docs/tasks/tools/install-kubectl/
How it works
Nginx-parser, parsing Nginx access.log line by line, after recognizing any change in log file, a post request will be sent with some data like $remote_addr and $host to the Metricsreporter Webservice. Metricsreporter will grab information from Geo dataset with previous step data and make that a metrics for Proemtheus on /metrics.
Note: This application uses Nginx log file (Main Nginx that installed on server), not a Ingress-nginx logs(On Kubernetes).
Nginx logFormat
Nginx-parser uses a default nginx log format, that gives you information about location of your visitors. But if you want more information for example what kind of host or how many hosts were requested by the visitors, you should change nginx log format. For example, for our custom dashboard, You should change this part of nginx.conf:
log_format main '$remote_addr - $remote_user [$time_local] '
                    '"$request" $status $body_bytes_sent '
                    '"$http_referer" "$http_user_agent" "$host"';

access_log /var/log/nginx/access.log main;
Note: By default,
log_formatsection doesn't exist innginx.conf, You should add the code above.
And change LOGREGFORMAT from nginx-geo-metricsreporter/values.yaml(uncomment that in nginx-geo-metricsreporter/values.yaml):
(?P<ipaddress>\d{1,3}\.\d{1,3}\.\d{1,3}\.\d{1,3}) - - \[(?P<dateandtime>\d{2}\/[a-z]{3}\/\d{4}:\d{2}:\d{2}:\d{2} (\+|\-)\d{4})\] ((\"(GET|POST) )(?P<url>.+)(http\/1\.1")) (?P<statuscode>\d{3}) (?P<bytessent>\d+) (["](?P<refferer>(\-)|(.+))["]) (["](?P<useragent>.+)["]) (["](?P<host>.+)["])
If you have a different log format, for your own usage, you can simply change LOGREGFORMAT in values.yaml. This variable tells the application what Regex format should be used for parsing lines of log. For example Nginx uses this log format by default:
127.0.0.1 - - [03/Jul/2020:19:31:17 +0430] "GET / HTTP/1.1" 304 0 "-" "Mozilla/5.0 (X11; Ubuntu; Linux x86_64; rv:77.0) Gecko/20100101 Firefox/77.0"
And regex work with that should be like this:
(?P<ipaddress>\d{1,3}\.\d{1,3}\.\d{1,3}\.\d{1,3}) - - \[(?P<dateandtime>\d{2}\/[a-z]{3}\/\d{4}:\d{2}:\d{2}:\d{2} (\+|\-)\d{4})\] ((\"(GET|POST) )(?P<url>.+)(http\/1\.1")) (?P<statuscode>\d{3}) (?P<bytessent>\d+) (["](?P<refferer>(\-)|(.+))["]) (["](?P<useragent>.+)["])
Application uses that Regex for parsing line, and the result is:
{
  "ipaddress": "127.0.0.1",
  "dateandtime": "04/Jul/2020:20:45:01 +0430",
  "url": "/",
  "statuscode": "200",
  "bytessent": "134",
  "refferer": "-",
  "useragent": "Mozilla/5.0 (X11; Ubuntu; Linux x86_64; rv:78.0) Gecko/20100101 Firefox/78.0"
}
Note: Do NOT change or rename the keys name, if you do, application cannot recognize that.
Monitoring and Visualization
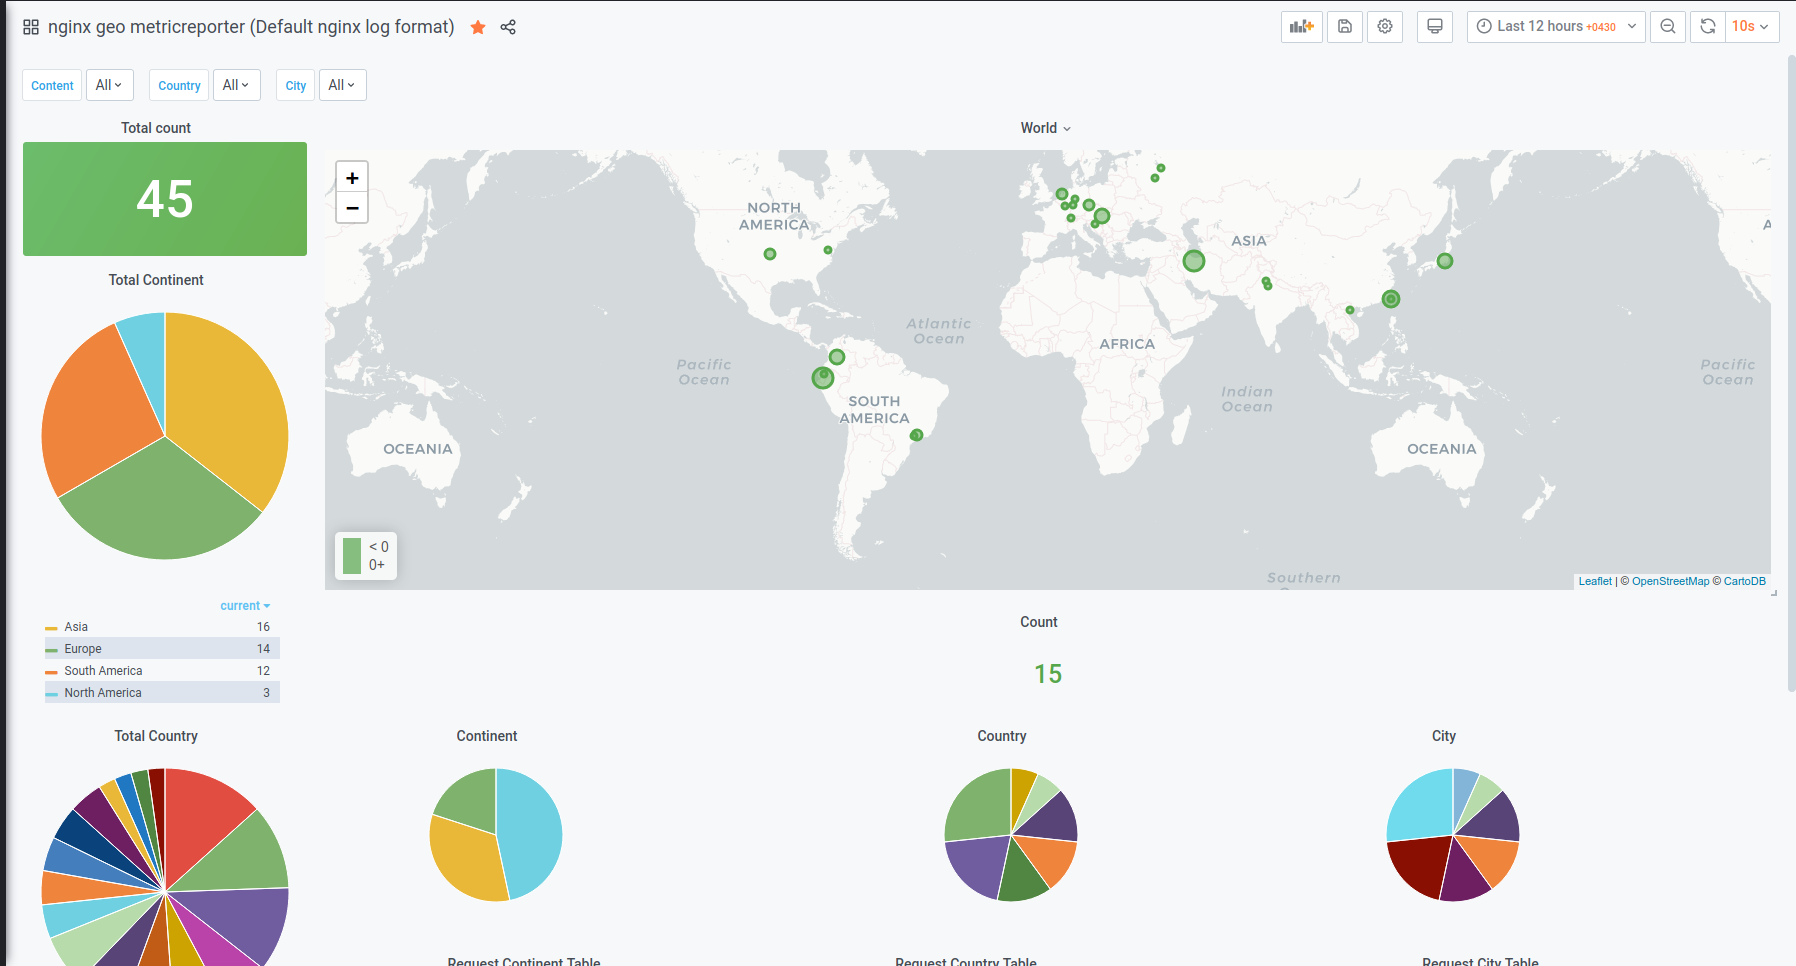
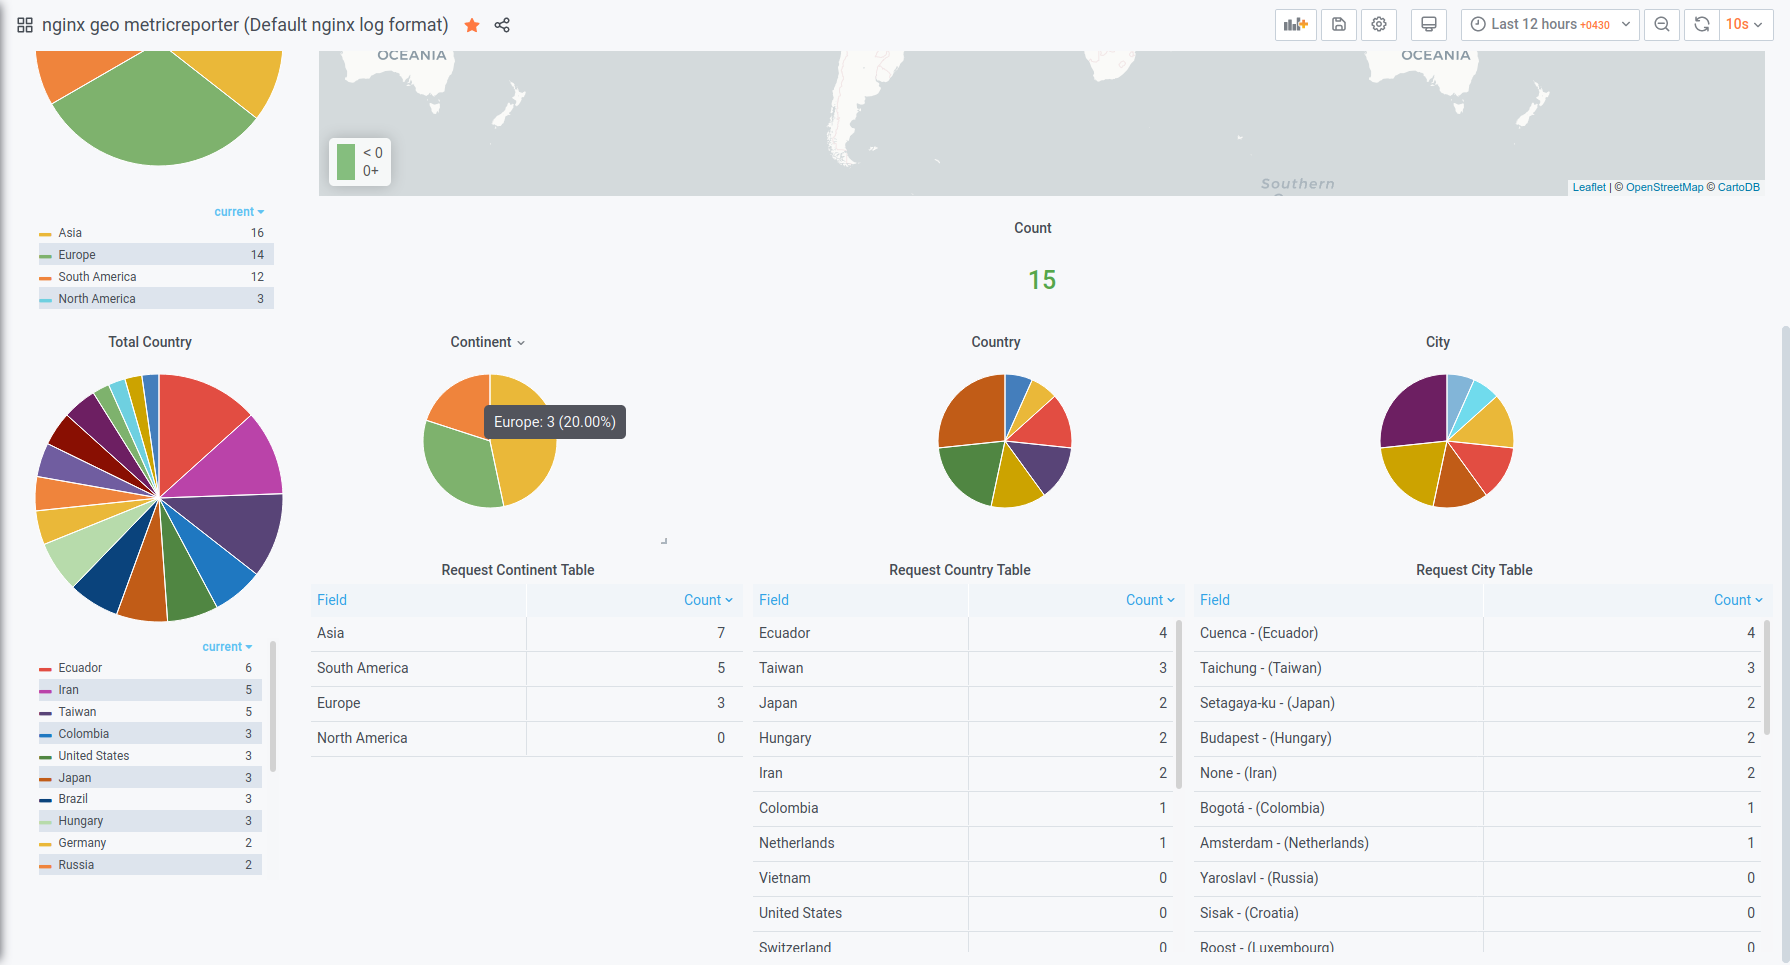
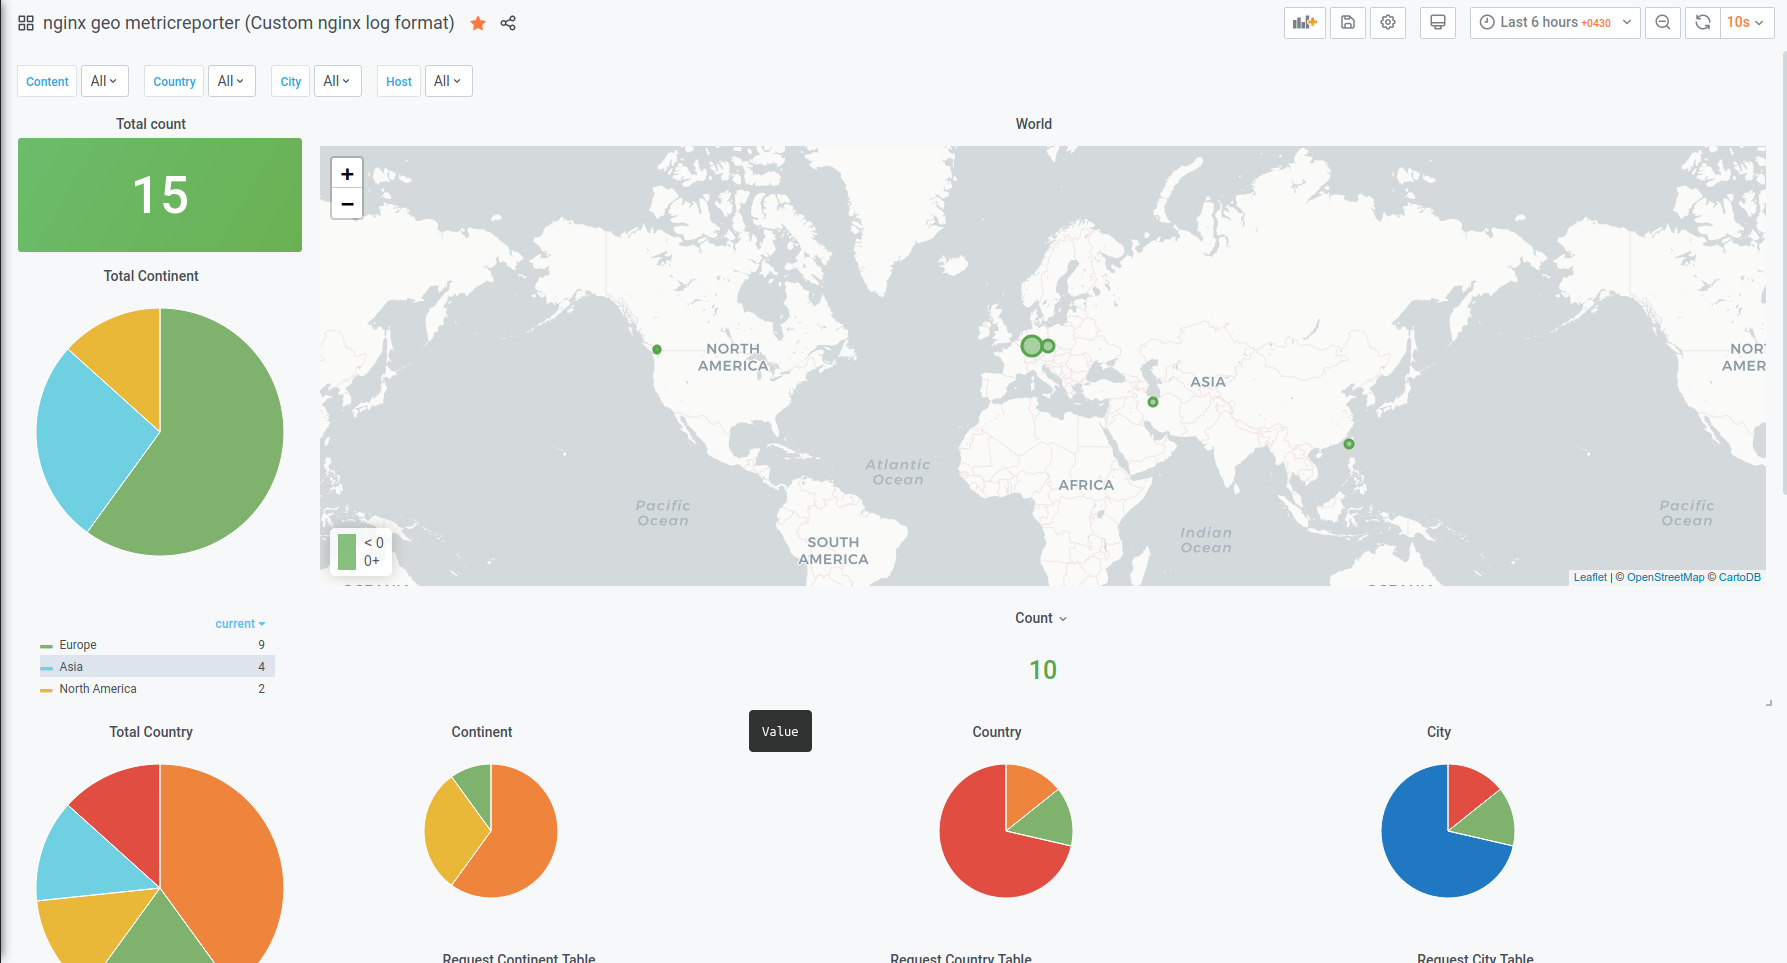
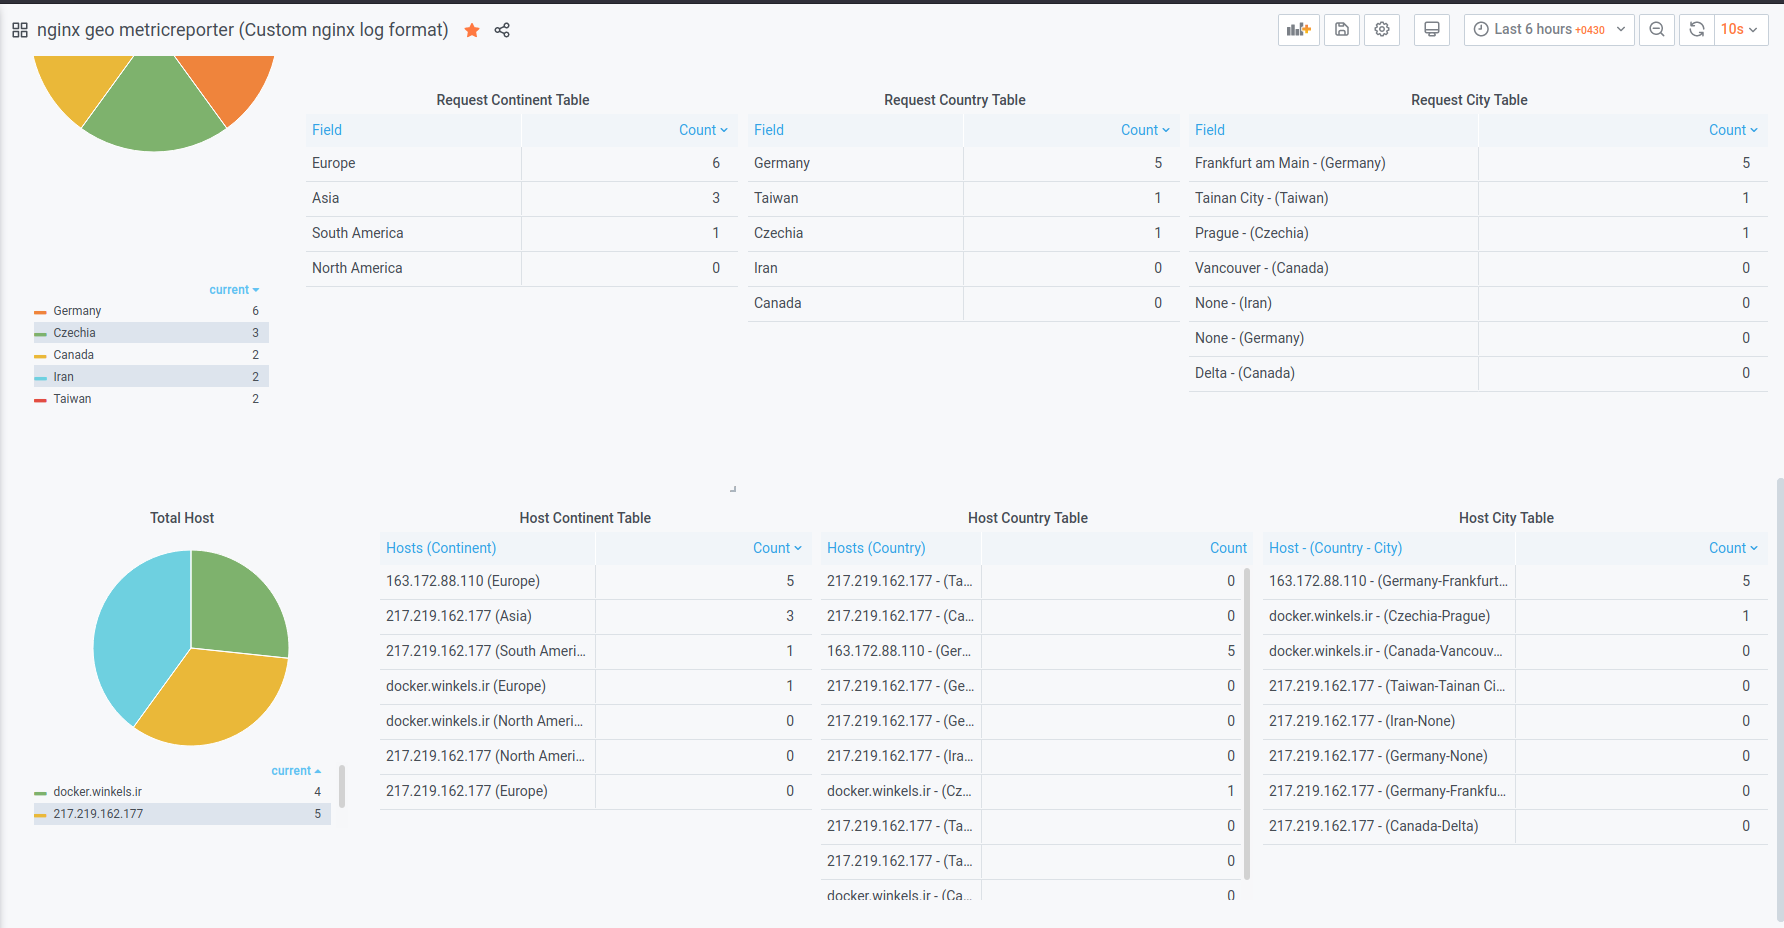
You can simply use that metrics to see your visitors' location on world map. I created a Grafana dashboard with Woldmap,piechart panel and some tables ordered by Continent,Country and City.
Default dashboard
You can learn more about how dashboard can be installed from this page.
Note: This dashboard works with default configuration setup (default nginx log format)
Custom dashboard
You can learn more about how dashboard can be installed from this page.
Note: This dashboard works with custom configuration setup (our custom nginx log format)
Install with Helm
Clone repository:
$ git clone https://github.com/fly304625/nginx-geo-metricsreporter.git
$ cd nginx-geo-metricsreporter
You can simply install it with Helm:
$ helm install nginx-geo-metricsreporter nginx-geo-metricsreporterThe command deploys Nginx-geo-metricsreporter on a Kubernetes cluster in the default configuration.
Configuration
| Parameter | Description | Default |
|---|---|---|
nodeSelector |
node labels for pod assignment | {} |
tolerations |
node taints to tolerate (requires Kubernetes >=1.6) | [] |
affinity |
pod affinity | {} |
nginxparser.Name |
nginxparser container name | nginxparser |
nginxparser.image.repository |
nginxparser container image repository | true |
nginxparser.image.tag |
nginxparser container image tag | latest |
nginxparser.image.pullPolicy |
nginxparser container image pull policy | IfNotPresent |
nginxparser.INPUT_LOG |
input log file | /var/log/nginx/access.log |
nginxparser.INTERVAL |
scrap timeout for parsing logs | 5 |
nginxparser.LOGREGFORMAT |
nginx log format | (?P<ipaddress ... |
nginxparser.resources |
nginxparser pod resource requests & limits | {} |
metricsreporter.Name |
metricsreporter container name | metricsreporter |
metricsreporter.image.repository |
metricsreporter container image repository | true |
metricsreporter.image.tag |
metricsreporter container image tag | latest |
metricsreporter.image.pullpolicy |
metricsreporter container image pull policy | IfNotPresent |
metricsreporter.service.type |
service type | ClusterIP |
metricsreporter.service.port |
TCP port on which the service is exposed | 8080 |
metricsreporter.resources |
nginxparser pod resource requests & limits | {} |
Note: We recommend using
nginxparser.INTERVAL(Don't change value to 0).
Note: Make sure you select correct
nodeSelectorthat installed nginx webservice on it.
Note: This application isn't scalable yet. So don't scale number of pod from 1 to more.
Note: Nginx
access.logis under the/var/log/nginxdirectory by default, if you store log on different location you should changenginxparser.INPUT_LOGfor that.
Dataset
We are geting our information form static GeoLite2-City.mmdb database file that can be old after while. If you always want to be updated, signup to maxmind.com and download your free GeoLite2-City.mmdb database and replace with geo-metricsreporter/datasets/GeoLite2-City.mmdb, build Docker image for yourself and change metricsreporter.repository and tag from nginx-geo-metricsreporter/values.yaml to update the app config.
Contributing , idea ,issue
Feel free to fill an issue or create a pull request, I'll check it ASAP


