Datapool of COVID-19 data from different sources, refurbished, simple data structure (JSON), different ways accessing the data.
The latest data can be accessed directly via a REST interface. It is also possible to use the project:
- local file system: using files in the local file system
- postgres: store data in a PostgreSQL database
- Google Firestore: store data in a Google Cloud Firestore database
The project is in beta phase. Interface changes might occur.
Before using this database read the documentation of the data which you want to use! A lot data of the sources might be incorrect or not what you expect. Please double check!
Examples:
- 'infected' mostly does not mean the number of really infected people but the number of known infected people - which has a high correlation to how many test are carried out and which people are tested (which differs from country to country).
- In the data from the German RKI the 'recovered' numbers are only a lower bound because recovery needs not to be reported officially.
- And a third example: The German RKI data contains only the cases which were transmitted electronically. Data which is transmitted by snail mail or by fax is currently not included. Therefore complete regions might have much higher numbers.
- Some sources provide data as summed up totals (like Johns-Hopkins); other as daily new cases (like ECDC).
Get complete data sets:
curl -H "Accept-Encoding: gzip" https://covid19datapool.appspot.com/v1/get_all/<name> | gunzip

where name is one of:
   ecdc_cases johns_hopkins_github gouv_fr_covid19_emergency_room_visits
   rki_cases
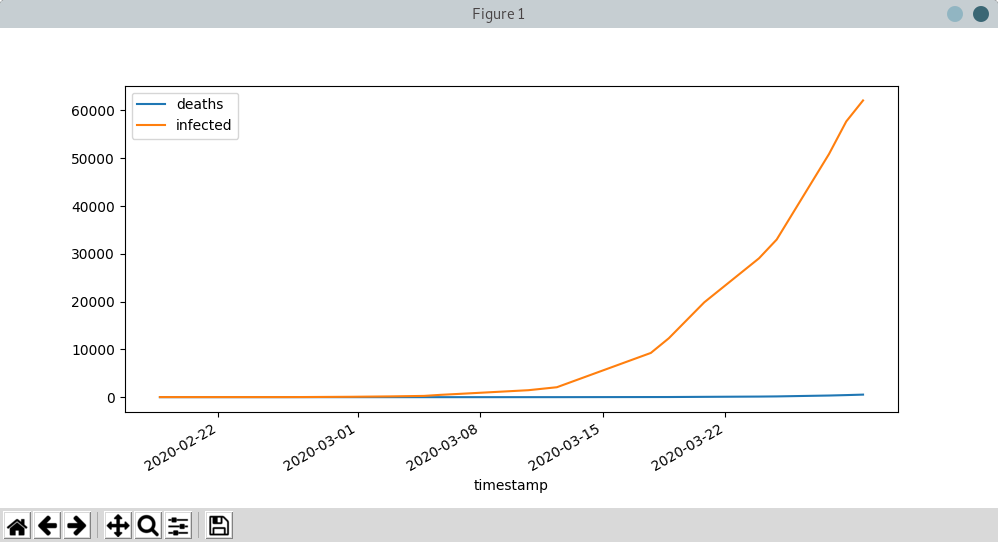
And the 10 liner to read, filter and display the data:
'''Download and prepare:
curl https://covid19datapool.appspot.com/v1/get_all/johns_hopkins_github | jq ".[1]" >johns_hopkins_github.json
'''
import pandas as pd
import matplotlib.pyplot as plt

COUNTRY = "DE"

data = pd.read_json("file:johns_hopkins_github.json")
data_jh = data.loc[(data['timestamp'] > '2020-02-15') & (data['iso-3166-1'] == COUNTRY)]
data_jh.plot(x="timestamp", y=["deaths", "infected"], kind="line")
plt.show()
Data format:
data[0]: "meta information - name, license, last update, ..."
data[1]: "list of dicts"
Example:
[
  {
    "name": "2019 Novel Coronavirus ...",
    "license": {
       "text": "This GitHub repo ..."
   },
   "id": "johns_hopkins_github",
   "last_updated": 1585332042.294029,
   "url": "https://github.com/CSSEGISandData/COVID-19"
  },
  [
    {
      "recovered": 0,
      "location": {
        "wgs84": {
          "longitude": -86.04051873,
          "latitude": 34.04567266
        },
        "iso-3166-1-alpha2": "US"
      },
      "deaths": 0,
      "source": "johns_hopkins_github",
      "confirmed": 0,
      "timestamp": 1585093051,
      "original": {
        "location": [ "US", "Alabama", "Etowah", "01055" ]
     }
    },
This is not the recommended way accessing data - but the only currently implemented. So stay in touch for possible changes and extensions: especially filters are planned.
Lots of maps, overviews and numbers that are currently published based on the data provided by the Johns-Hopkins CSSE. For example: Tagesschau or Berliner Morgenpost [4]. This data is a Hodgepodge of data from other sources that are 'easy' in one pot to be thrown.
An example: 'infected' in the record means that a person who is infected was tested. Not present in this record are however numbers of how many tests were run. An 'infected' on 10 tests is different from an 'infected' on 1000 tests. Making a meaningfull statement based on these numbers e.g. the effectiveness of measures (curfew, border closure, ...) is modern coffee grounds reading.
The goal of this project is to search for existing data sources, convert them and make them available to all who are interested in - especially as an alternative and extension of the benefits Johns-Hopkins data. Not every person who wants to research, compile statistics or calculate a new model would need to take care of the many and complex details, but can get started right away.
Because: every institution, authority, state, health department offers the data in its own form:nicely presented - but for further processing and analysis completely unsuitable. Add to that the license terms which are, at best, are unknown. All Germans Health departments of the federal states have Copyright on the case numbers, which makes it impossible to use, process or pass them on.
There are also some records of hospitalization from COVID-19 infected the French government. Based on this data, the Markov transition probabilities in the last paper from the RKI can be checked (page 4, Fig 1). If it would be possible to make more precise and substantiated statements here about estimates of the dark figure ('infected but not tested').
This project was founded during the WirVsVirus Hackathon of the German government which took place from 2020-03-20 until 2020-03-22.
The database provides data from different sources about COVID-19. The data is unified (has the same format) and converted to JSON.
Each data set can contain the following keys, i.e. most of the fields are optional:
- timestamp: interger; seconds since EPOCH
- deaths: integer
- infected: integer
- recovered: integer
- source: string; the source of the data
- iso-3166-1: 2 chars
- iso-3166-2: string
- longitute
- latitude
- original: dictionary; random data of the original data set which is (currently) not mapped
Example:
{
  "infected": 8,
  "iso-3166-1": "DE",
  "recovered": 0,
  "deaths": 0,
  "source": "johns_hopkins_github",
  "timestamp": 1580578380,
  "original": {
    "location": [
      "Germany"
    ]
  }
}TBD.
Every data source has a description in JSON format. This contains the license, information about the data fields and other information. A reference to this JSON file is given in each data source description.
This is a collection of world wide infected and deaths data collected by the ECDC.
- ID:
ecdc-xlsx - JSON meta data: metadata-ecdc-xlsx.json
- Area: world
The French government provides a set of data about emergency cases and sos medical acts.
- ID:
gouv_fr_covid19_emergency_room_visits - JSON meta data: metadata-gouv_fr_covid19_emergency_room_visits.json
- Area: France
This is a collection and aggregation of many other data sources from the Johns-Hopkins CSSE.
The format of the data changes from time to time. Also the detailes and location details. The latest data includes very detailed information about the US.
Please note that the original dataset contains some data more than once. This is filtered out - and only one instance of a data row is provided.
- ID:
johns_hopkins_github - JSON meta data: metadata-johns_hopkins_github.json
- Area: world
This is the 'standard' data set for Germany.
It is not allowed to use this data for commercial use.
- ID:
rki_cases - JSON meta data: metadata-rki_cases.json
- Area: world
URL: https://joachim-gassen.github.io/2020/03/tidying-the-new-johns-hopkins-covid-19-datasests/
The first step looks very similar to the current implementation here: tidy up the data, mapping regions / countries to ISO codes, ...
Thanks to the whole team ID#1757 of WirVsVirus for support and help and many, many links to data sources.
Thanks to Google for supporting this project by providing cloud resources on Google Cloud for database and WEB services.

