In 2022, it was found that around 63% of Americans regularly engage in drinking alcohol, be it socially or otherwise. In our project, we wanted to dig deeper into:
- How much alcohol Americans consumed in 2022.
- The adverse effects of alcohol, and how many people have died due to alcohol-related causes.
- How many medical facilities per state are available to assist with alcohol addiction?
Tech stack: Python, MongoDB, Flask, HTML, CSS, JavaScript (Leaflet, Bootstrap, D3)
Fiza, Mimi, Nivetha, Katherine, Shipra
Please run our mongo.ipynb file to store our database in your local MongoDB system. This will allow you to successfully access our API end-routes.
- What are the top states with the highest alcohol consumption per capita?
- What are the top states with the highest alcohol-related fatalities?
- Distribution of alcohol consumption type by state.
- Which demographics are most affected by alcohol-related deaths in the highest 3 states?
- Are there sufficient rehabilitation resources in areas where alcohol-related deaths are prevalent, for example, California?
- Is there a relationship between the amount of alcohol consumption per capita and the amount of available resources for alcoholism?
Once we gathered our data sources, we looked at the information holistically and isolated our facility research to 3 states for a smaller sample size.
-
Our data was procured through a range of CSVs and Web Scraping, focusing on public health data around alcohol consumption in the US in 2022. We extracted and transformed this data into readable JSONs.
-
We decided to use Mongo DB to store our data, as the information we collected was mostly suited for a non-relational database.
-
Our site is hosted on Flask. The primary elements that we considered were,
- Our home page would house our HTML code and in turn our main Javascript code.
- There would be API endpoints available to our users curious about our data.
-
We incorporated map objects to visualize the data pertaining to alcohol consumption & rehabilitation facilities (cluster marker map). We procured a geojson for state coordinates.
-
We created a dashboard by web scraping to accumulate the data and combine it with other extraction methods.
We created 4 unique visualizations in the dashboard utilizing D3, Plotly, Leaflet, and Bootstrap.
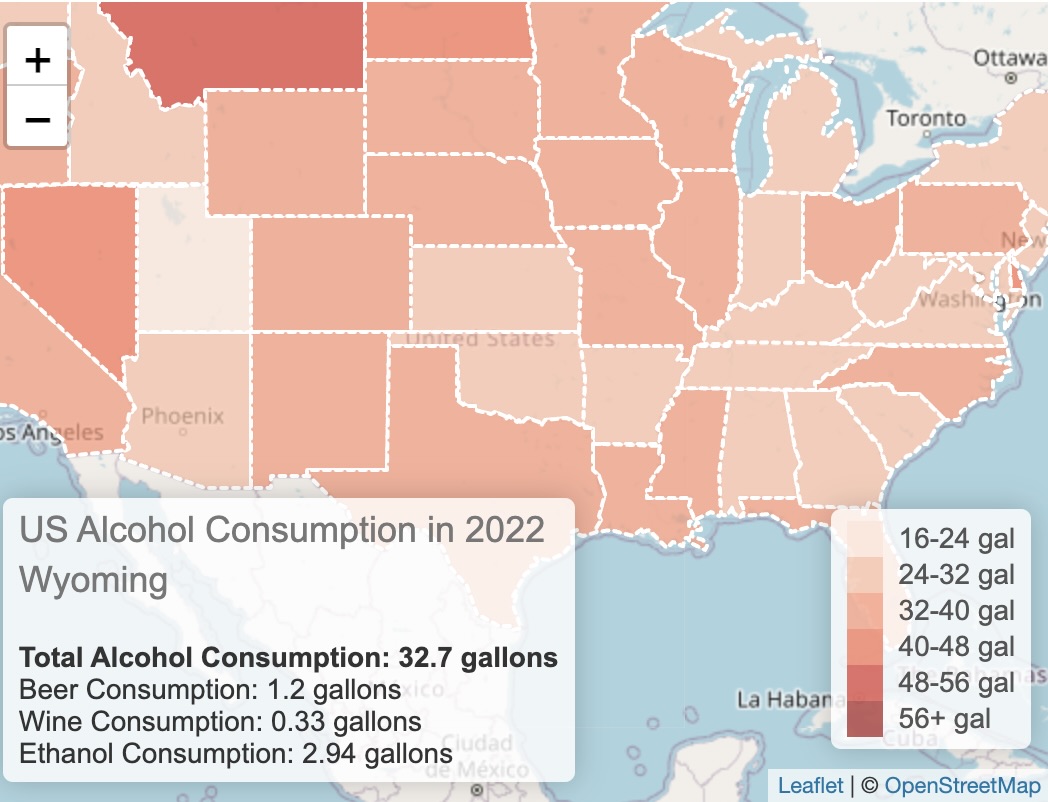
- Alcohol consumption interactive GeoJSON map has a zoom-in feature and displays information on alcohol consumption per capita based on user selection of states. It shows the highest and lowest consumption based on the color gradient in the legend section.
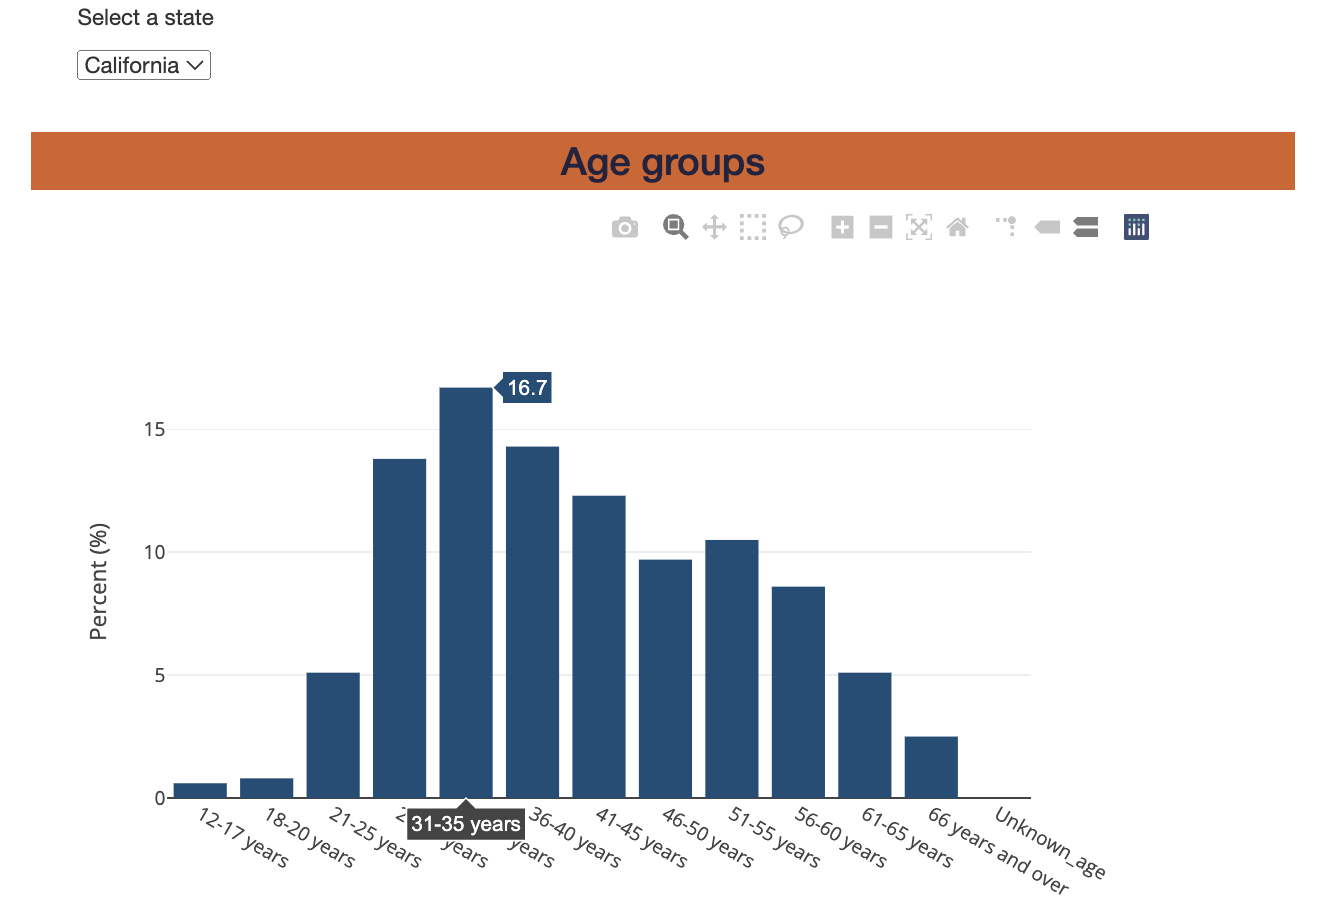
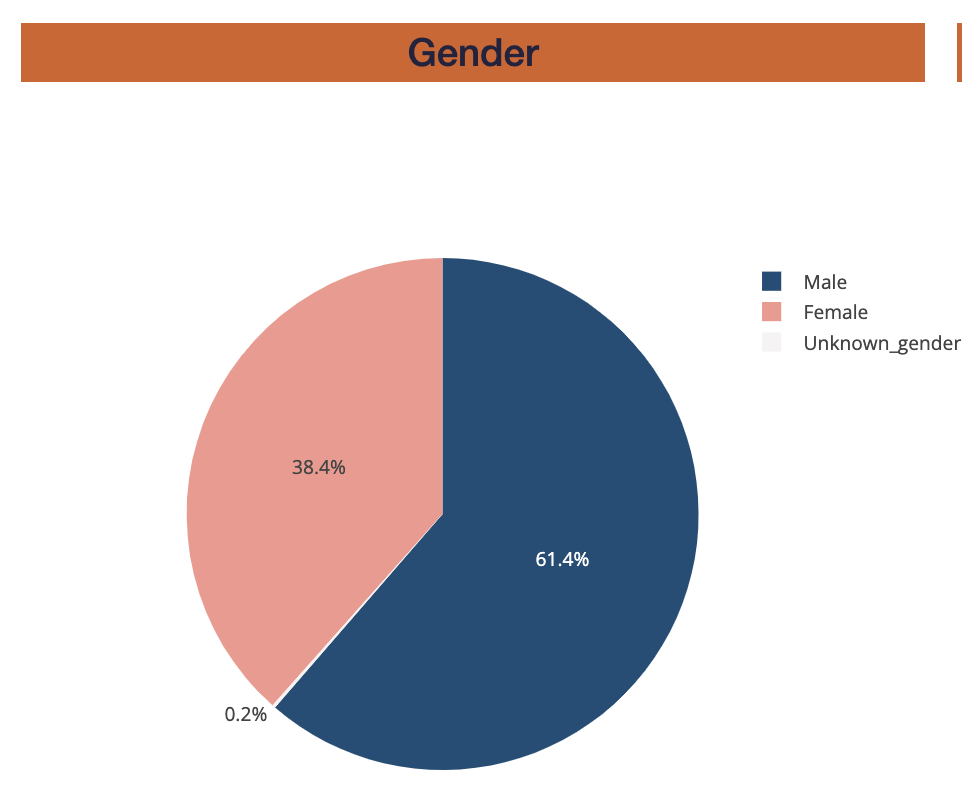
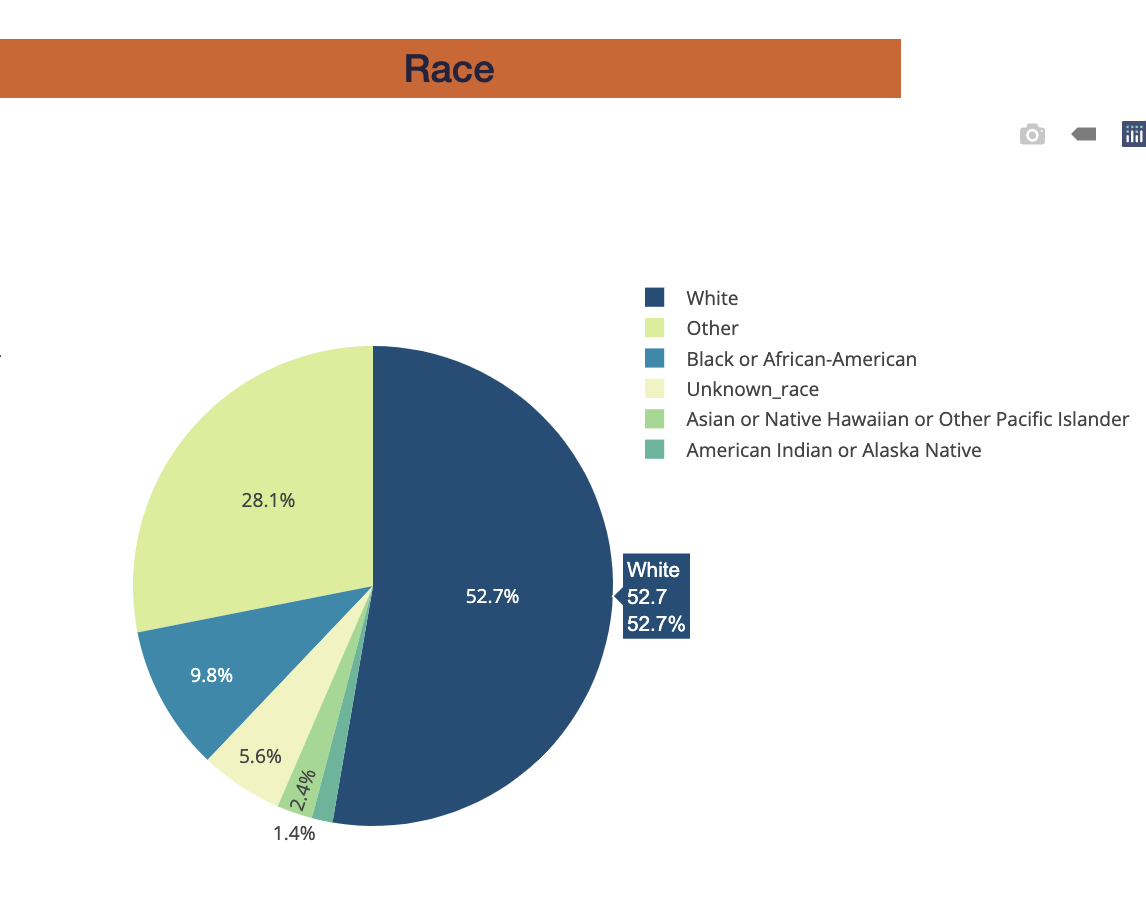
- Alcohol fatalities have features like a drop-down for the selection of states, zoom in and out to maximize or minimize the information on the plot, and a hover-over display of demographic information including age groups, gender, and race distribution.
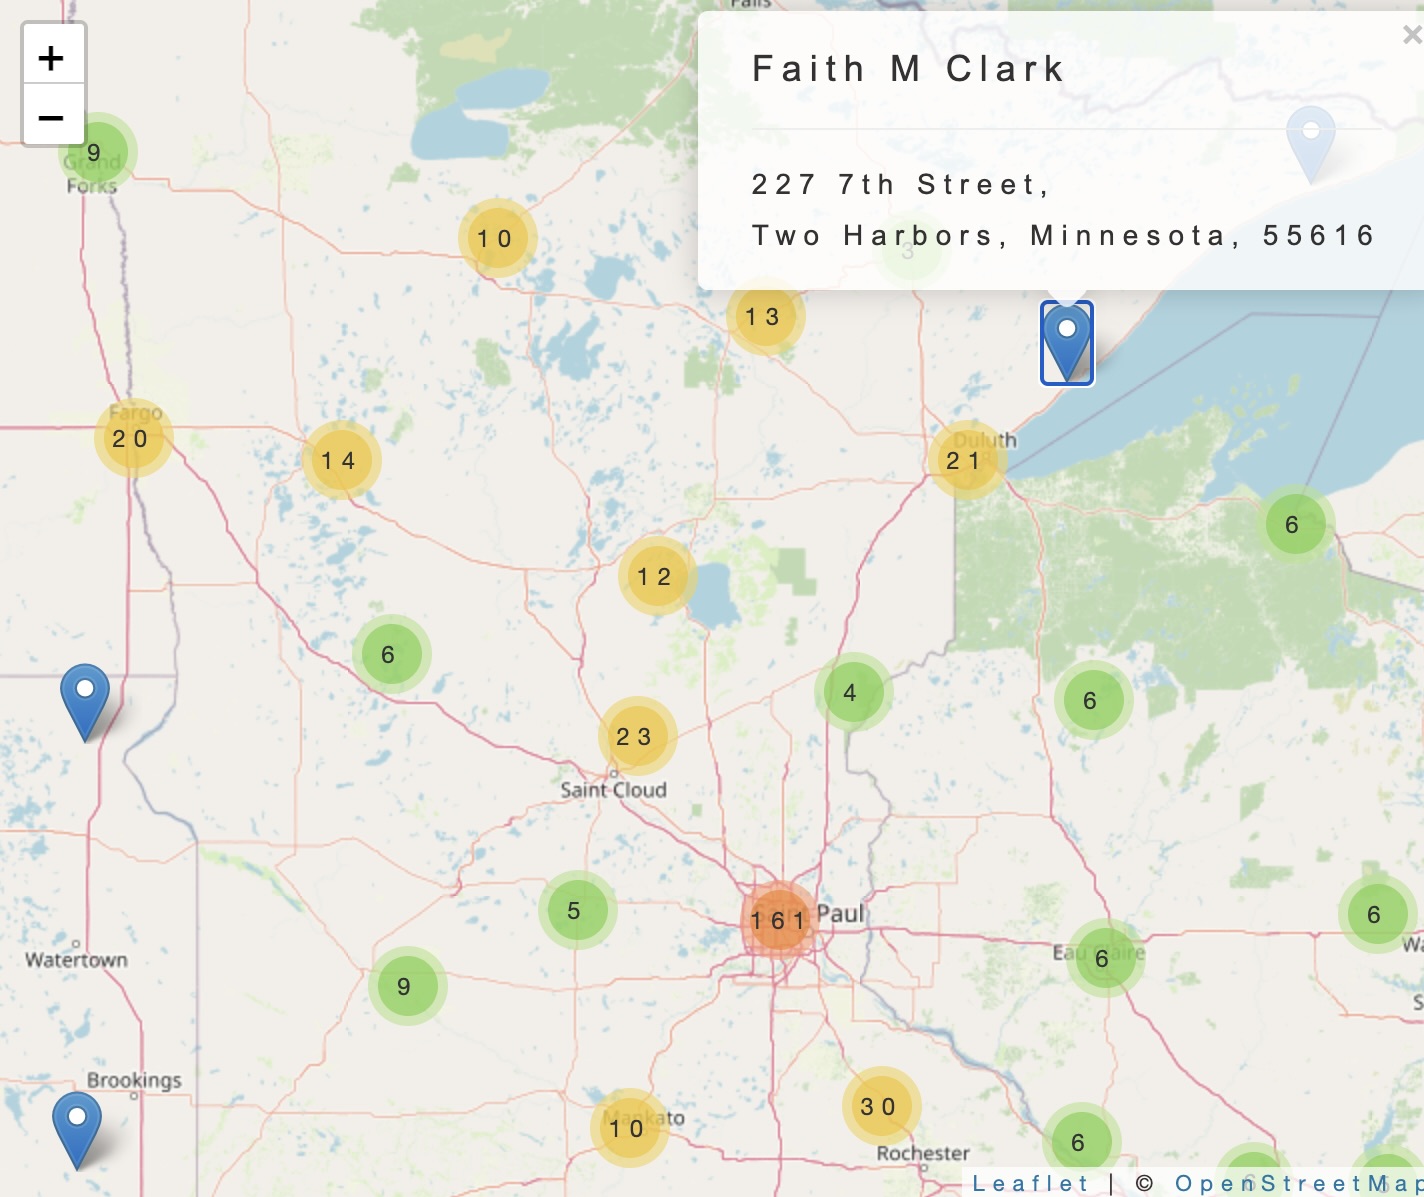
- Rehab facilities have an interactive cluster marker map which has a zoom-in feature and a hover-over feature to highlight the area and click on for selection of markers to display the number of alcohol rehabilitation facilities per capita. By zooming in further and clicking on a specific cluster marker, the user can find information on a particular rehabilitation facility in the area.
-
Montana, New Hampshire, and Vermont were found to be the states with the highest consumption per capita. Based on more research, these states had a low index in population diversity and were the top 10 states with the lowest population per capita.
-
We found out the top 3 states with the highest alcohol-related deaths per population were California, Florida, and Texas. These states had high populations and high diversity index. So, we explored the demographics of these states.
-
We found information on beer, wine, and ethanol consumption per state. Ethanol consumption represented the highest type of consumption in the top 3 states including Montana, New Hampshire, and Vermont.
-
We observed a common pattern in these 3 states. The age group between 26-45 years old represented the highest death rate and more than 60% were white male population. We also observed Texas white population experienced 85% of the death rate due to excess alcohol consumption.
-
No, there are not enough rehabilitation resources in areas where alcohol-related deaths are prevalent to support the population's demand. For example: California representing the highest number of deaths, is among the fifteen states with the lowest number of rehab facilities per capita. Texas in particular has the least number of facilities per capita in the United States.
-
We observed a relationship between the amount of alcohol consumption per capita and the amount of available resources for alcoholism. Montana is one of the top 3 states with the highest alcohol consumption rate per capita and is also one of the top three states with the highest number of facilities per capita. New Hampshire ranks 19th, and Vermont is ranked 9th with the highest number of facilities per capita. California, Florida, and Texas are among the 15 states with the lowest number of rehabilitation facilities per capita despite having a high population as well as a high alcohol-related fatality rate.
In our initial research, we found a javascript library called “Algolia Places” but were unable to spend enough time to integrate it. It would enhance user's search for better experience. Using GeoSearch, Algolia Places can create a search bar on our website that would help struggling alcohol addicts look for rehabilitation facilities in their neighborhoods.
- Alcohol consumption
- US States GeoJSON
- SAMHSA Alcohol Fatalities
- SAMHSA Alcohol Rehab Facilities
- Population per state This was used for per capita research.
- States with highest alcohol consumption per population:
https://www.bankrate.com/insurance/car/drunk-driving/#stats-2022
https://drugabusestatistics.org/alcohol-related-deaths/
