Scripts to analyze GPS JSON data generated by gpsd and gpspipe and make plots of position changes and satellite visibility over time. This is a modern alternative for gpsprof.
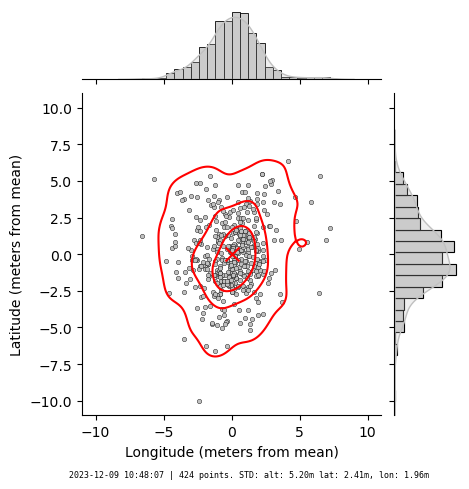
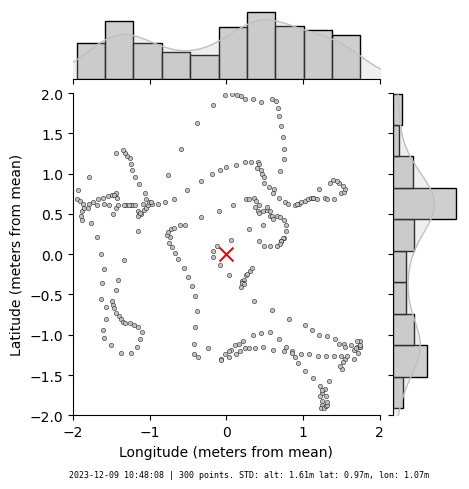
gpsjsonplot-pos.py |
|
 |
 |
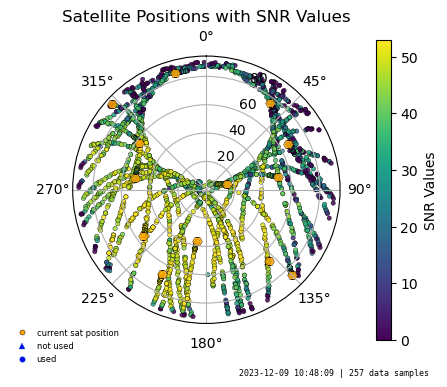
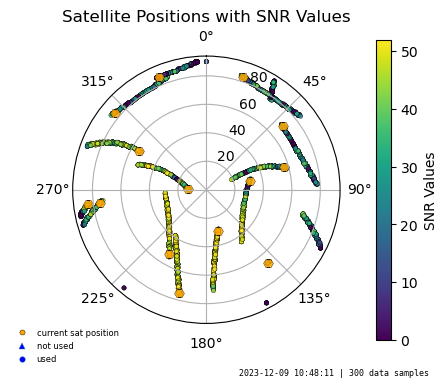
gpsjsonplot-sats.py |
|
 |
 |
gpsdup and running;gpspipeor other source of json data- Python 3.x with python packages:
json,matplotlib,numpy,seaborn
# get some samples from gpsd
gpspipe -v -w -n 10 > input.json

# make a plot of position changes using 100 data points with contour lines
python gpsjsonplot-pos.py --json  input.json --outfile plot-lat-lon.png --n 100 --contour 4

# the same but for all data points and without contours lines
python gpsjsonplot-pos.py --json  input.json --outfile plot-lat-lon2.png --n 1 --contour 0

# plot satellites, with sampling 10 data points
python gpsjsonplot-sats.py --json input.json --outfile plot-sattelites.png --n 10

# plot satellites, all data points
python gpsjsonplot-sats.py --json input.json --outfile plot-sattelites2.png --n 0--json: Path to the input JSON file containing GPS data.--outfile: Path to the output image file where the plot will be saved.--n: Optional parameter to uniformly select n data points.--contour: Optional: number of contour lines. 0 - disables it.