RT-MAP
Real time map manager.

Vagrant version
Prerequisites
- Vagrant 1.8.1 or greater
Instructions
- Download Vagrant file
- Run
vagrant up
Then it will need about 4-5 minutes depending on your bandwidth. When it ends you can see a message like:
Listening on port: 10101
Open your browser on http://localhost:10101/ and enjoy.
Local version
If vagrant version is too hard to deploy then try with the local version.
Prerequisites
- Python, version 2.7 branch (
sudo apt-get install python) - Python-gdal, version 1.11 or greater (
sudo apt-get install python-gdal) - Git, version 2.7.4 or greater (
sudo apt-get install git) - NodeJS LTS runtime with NPM, version 8 or greater (
curl -sL https://deb.nodesource.com/setup_8.x | sudo -E bash -; sudo apt-get -y install nodejs)
Installation
Run this in terminal:
git clone https://github.com/ffis/rt-map
cd rt-map
npm install
vim config.json  # config default port and datadir directory
Installation process in video
Run the application
node .Then open your browser (a recent one). The default URL is: http://localhost:[config.json.port]/ where config.json.port is the parameter you may have changed on config.json file.
Example of usage
Let's imagine that we have an indoor map, for example a hospital service indoor map. What we want to do is see how evolves the capacity or occupation over the time or best say, in real time.
What do we need?
We need:
- Before start requisites:
- an indoor map in high resolution, let's say of at least 2000px of width and 1000px of height.
- a web service that provides real time information related to what beds are being used and some details of who does.
- Phase 1:
- run the map manager
- a couple of minutes to set where every bed is located.
- download the map as zip
- Phase 2:
- unzip the downloaded file
- configure the api.js file
- deploy using a lightweight web server
Before start requisites:
- An indoor map in high resolution:

Note this image is not related to us and credit belongs to its owner.
- A web service with real time information
Here you may have an url that returns data in a web the browser can handle like JSON, XML or CSV. For example, in JSON it might look like this:
[
    {
        "patient":{
            "name":"Loksly",
            "fullname":"B. Loksly",
            "gender":"male"
        },
        "room":"1A"
    },
    {
        "patient":{
            "name":"Diana",
            "fullname":"D. Loksly",
            "gender":"female"
        },
        "room":"1B"
    }
]
Note here the "room" attribute is what you will need to match with the name of the assets you will enter in Phase 1.
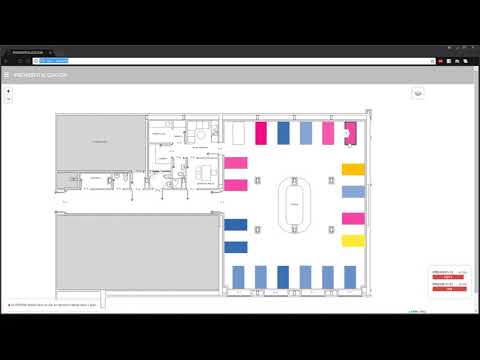
Phase 1
Now that the application is listening on port 10101, open the browser on: http://localhost:10101/
You'll se a window with a blue button that enables you to "Upload an image". Press on it an choose your image. After uploading it gets some time to process it and render the map. When it ends you'll see the map and you can zoom using the wheel of the mouse, you may also pan clicking on the map using drag and drop. Most of this magic belongs to leaflet team.
Let's continue with the beds of the hospital service example and suppose your assets, have a rectangle figure. Press on "Rectangle", enter the unique name of the asset on the field "name of the new sprite", click on the top-left corner of the asset and click on the bottom-right corner of the asset. That's it. Change the name and repeat the process until no more assets left. Just to use the same terminology let's call each of these rectangles Sprite. When you are done go to the "Details" section and enter the title of the map. Press on the "Send changes to server and refresh map" button. Now you can download the map using "Download map" button.
If you need to change an Sprite, add a new one or delete save the link for later usage. It will work unless you delete the data directory you have set on config.json file.
 Example of Phase 1
Phase 2
After you uncompress the zip file you'll see a directory with several files. You may change what file you want to get your view but it should be enough to keep your changes only on api.js file. This file has a default implementation where you have access to window, document, leafletmap and jQuery objects.
The main parts of the code you need to pay attention to are:
loadElements method: This method is called each time your data need to be retrieved, it should return a Promise. The default implementation is a $.getJSON, but you may use another Promise based method instead. The Promise should return an array of objects.
rtMapAPI.prototype.loadElements = function() {
	return $.getJSON('testdata.json'); /* note you may add a callback=? parameter to use JSONP */
};
matches method: This method is called to check which of the elements downloaded using loadElements method which sprite represents it.
featureProperties.id is the name you have entered on each sprite on phase 1 and name is the attribute that should have the same value if the element is occupying that sprite.
rtMapAPI.prototype.matches = function(element, featureProperties) {
	return featureProperties.id === element.name; //you probably only want to change "name" to something different and keep the rest of the method as it is.
};
style method: This method sets for an sprite how it should be drawn depending on which elements have been matched using the matches method.
rtMapAPI.prototype.style = function(elements){
	return {
		fillColor: (elements.length === 1 ? (elements[0].attr === 'specialValue' ? '#4E2AFC' : '#FC4E2A') : '#FC4AE2'),
		weight: 2,
		opacity: elements.length === 0 ? 0 : 1,
		color: 'white',
		dashArray: '3',
		fillOpacity: elements.length === 0 ? 0 : 0.01 * elements[0].mySpecialAttribute
	};
};
getPopupText method: This method should return a text that is rendered like a tooltip text.
rtMapAPI.prototype.getPopupText = function(elements){
	return elements.map(function(element){
		return element.name + ' ' + element.mySpecialAttributeDetails + ' <a href="#">' + element.mySpecialAttribute + '</a>';
	}).join(', ');
};
setRefreshTimeout method: This method sets an interval of the time the map should ask for new updates. In practice when the timeout happens the loadElements method is called and the sprites are re-styled.
rtMapAPI.prototype.setRefreshTimeout = function(cb) {
	setInterval(cb, 3000);
};
ready method: This method runs when the map has been loaded before the data has been retrieved for the first time.
rtMapAPI.prototype.ready = function() {

};
setVisible method: This method is called to let you know which of the elements that loadElements method have downloaded have a sprite that represents them.
rtMapAPI.prototype.setVisible = function(elements){
	this.elements = elements;
};
As an example of what you may get after a properly configured api.js file look this video:
Copyright notes:
This software uses a modified version of gdal2tiles.py named gdal2tiles-leaflet, available under MIT license following this link: https://github.com/commenthol/gdal2tiles-leaflet This code belongs to:
- Copyright (c) 2008, Klokan Petr Pridal
- Copyright (c) 2010-2013, Even Rouault
This software is available under MIT license:
- Copyright (c) 2018, FFIS
Author: Loksly https://github.com/loksly/