Multiple Hidden Markov Model Regression (HMMR) for the segmentation of multivariate time series with regime changes.
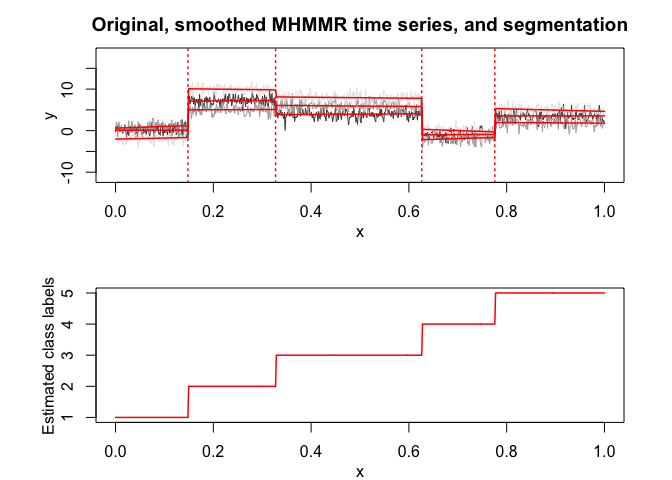
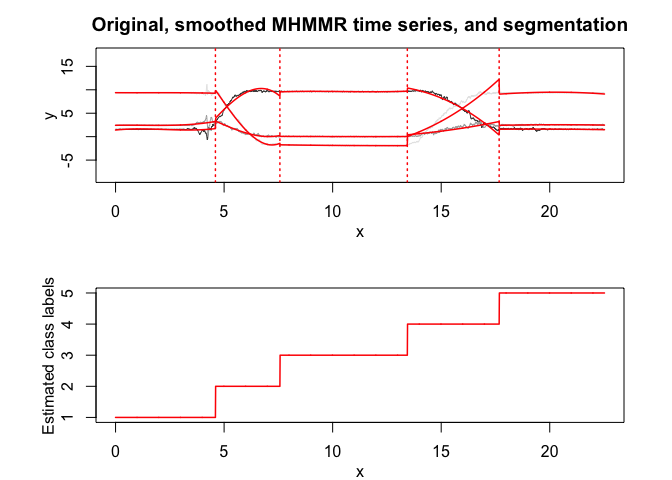
The model assumes that the time series is governed by a sequence of hidden discrete regimes/states, where each regime/state has multivariate Gaussian regressors emission densities. The model parameters are estimated by MLE via the EM algorithm.
You can install the development version of MHMMR from GitHub with:
# install.packages("devtools")
devtools::install_github("fchamroukhi/MHMMR")
To build vignettes for examples of usage, type the command below instead:
# install.packages("devtools")
devtools::install_github("fchamroukhi/MHMMR",
                         build_opts = c("--no-resave-data", "--no-manual"),
                         build_vignettes = TRUE)
Use the following command to display vignettes:
browseVignettes("MHMMR")library(MHMMR)# Application to a simulated data set
data("toydataset")
x <- toydataset$x
y <- toydataset[, c("y1", "y2", "y3")]
K <- 5 # Number of regimes (states)
p <- 1 # Dimension of beta (order of the polynomial regressors)
variance_type <- "heteroskedastic" # "heteroskedastic" or "homoskedastic" model
n_tries <- 1
max_iter <- 1500
threshold <- 1e-6
verbose <- TRUE
mhmmr <- emMHMMR(X = x, Y = y, K, p, variance_type, n_tries,
max_iter, threshold, verbose)
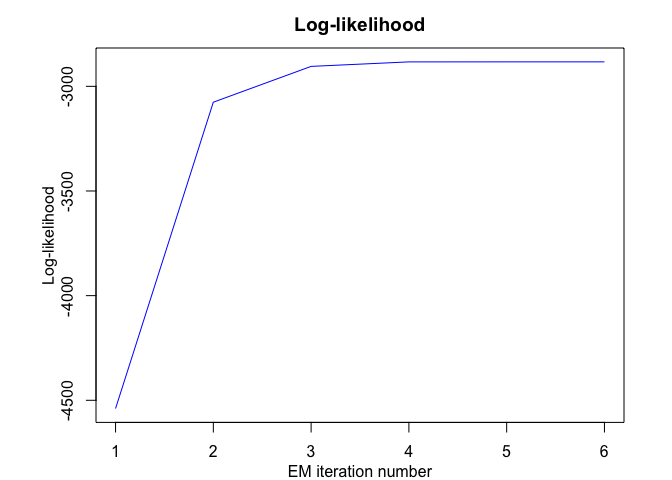
#> EM - MHMMR: Iteration: 1 | log-likelihood: -4539.37845473736
#> EM - MHMMR: Iteration: 2 | log-likelihood: -3075.7862970485
#> EM - MHMMR: Iteration: 3 | log-likelihood: -2904.71126233611
#> EM - MHMMR: Iteration: 4 | log-likelihood: -2883.23456594806
#> EM - MHMMR: Iteration: 5 | log-likelihood: -2883.12446634454
#> EM - MHMMR: Iteration: 6 | log-likelihood: -2883.12436399888
mhmmr$summary()
#> ----------------------
#> Fitted MHMMR model
#> ----------------------
#>
#> MHMMR model with K = 5 regimes
#>
#> log-likelihood nu AIC BIC
#> -2883.124 84 -2967.124 -3156.43
#>
#> Clustering table:
#> 1 2 3 4 5
#> 100 120 200 100 150
#>
#>
#> ------------------
#> Regime 1 (k = 1):
#>
#> Regression coefficients:
#>
#> Beta(d = 1) Beta(d = 2) Beta(d = 3)
#> 1 0.11943184 0.6087582 -2.038486
#> X^1 -0.08556857 4.1038126 2.540536
#>
#> Covariance matrix:
#>
#> 1.19064336 0.12765794 0.05537134
#> 0.12765794 0.87145062 -0.05213162
#> 0.05537134 -0.05213162 0.87886166
#> ------------------
#> Regime 2 (k = 2):
#>
#> Regression coefficients:
#>
#> Beta(d = 1) Beta(d = 2) Beta(d = 3)
#> 1 6.921139 4.9377164 10.290536
#> X^1 1.131946 0.4684922 -1.419758
#>
#> Covariance matrix:
#>
#> 1.0688949 -0.18240787 0.12675972
#> -0.1824079 1.05317924 0.01419686
#> 0.1267597 0.01419686 0.76030310
#> ------------------
#> Regime 3 (k = 3):
#>
#> Regression coefficients:
#>
#> Beta(d = 1) Beta(d = 2) Beta(d = 3)
#> 1 3.6576562 6.3642526 8.493765
#> X^1 0.6155173 -0.8844373 -1.137027
#>
#> Covariance matrix:
#>
#> 1.02647251 -0.05491451 -0.01930098
#> -0.05491451 1.18921808 0.01510035
#> -0.01930098 0.01510035 1.00352482
#> ------------------
#> Regime 4 (k = 4):
#>
#> Regression coefficients:
#>
#> Beta(d = 1) Beta(d = 2) Beta(d = 3)
#> 1 -1.439637 -4.463014 2.952470
#> X^1 0.703211 3.649717 -4.187703
#>
#> Covariance matrix:
#>
#> 0.88001190 -0.03249118 -0.03411075
#> -0.03249118 1.12088583 -0.07881351
#> -0.03411075 -0.07881351 0.86061127
#> ------------------
#> Regime 5 (k = 5):
#>
#> Regression coefficients:
#>
#> Beta(d = 1) Beta(d = 2) Beta(d = 3)
#> 1 3.4982408 2.5357751 7.652113
#> X^1 0.0574791 -0.7286824 -3.005802
#>
#> Covariance matrix:
#>
#> 1.13331209 0.25869951 0.03163467
#> 0.25869951 1.21231741 0.04746018
#> 0.03163467 0.04746018 0.80242715
mhmmr$plot(what = c("smoothed", "regressors", "loglikelihood"))# Application to a real data set (human activity recognition data)
data("realdataset")
x <- realdataset$x
y <- realdataset[, c("y1", "y2", "y3")]
K <- 5 # Number of regimes (states)
p <- 3 # Dimension of beta (order of the polynomial regressors)
variance_type <- "heteroskedastic" # "heteroskedastic" or "homoskedastic" model
n_tries <- 1
max_iter <- 1500
threshold <- 1e-6
verbose <- TRUE
mhmmr <- emMHMMR(X = x, Y = y, K, p, variance_type, n_tries,
max_iter, threshold, verbose)
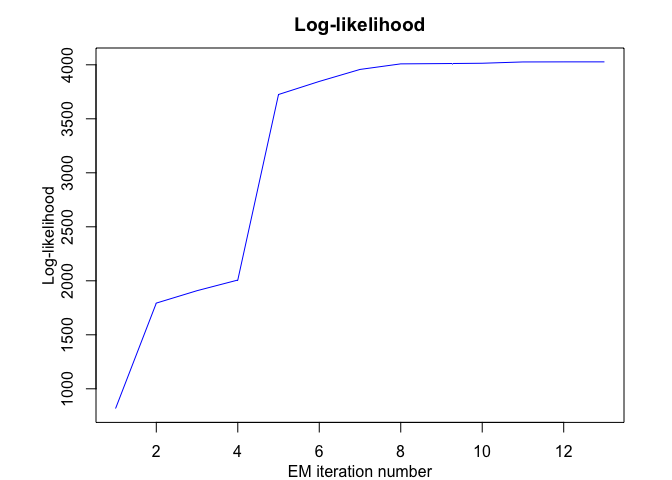
#> EM - MHMMR: Iteration: 1 | log-likelihood: 817.206309249687
#> EM - MHMMR: Iteration: 2 | log-likelihood: 1793.49320726452
#> EM - MHMMR: Iteration: 3 | log-likelihood: 1908.47251424374
#> EM - MHMMR: Iteration: 4 | log-likelihood: 2006.7976746047
#> EM - MHMMR: Iteration: 5 | log-likelihood: 3724.91911814713
#> EM - MHMMR: Iteration: 6 | log-likelihood: 3846.02584774854
#> EM - MHMMR: Iteration: 7 | log-likelihood: 3957.04953794437
#> EM - MHMMR: Iteration: 8 | log-likelihood: 4008.60804596975
#> EM - MHMMR: Iteration: 9 | log-likelihood: 4011.09964067314
#> EM - MHMMR: Iteration: 10 | log-likelihood: 4014.35810165377
#> EM - MHMMR: Iteration: 11 | log-likelihood: 4026.38632031497
#> EM - MHMMR: Iteration: 12 | log-likelihood: 4027.13758668835
#> EM - MHMMR: Iteration: 13 | log-likelihood: 4027.13639613206
mhmmr$summary()
#> ----------------------
#> Fitted MHMMR model
#> ----------------------
#>
#> MHMMR model with K = 5 regimes
#>
#> log-likelihood nu AIC BIC
#> 4027.136 114 3913.136 3587.095
#>
#> Clustering table:
#> 1 2 3 4 5
#> 461 297 587 423 485
#>
#>
#> ------------------
#> Regime 1 (k = 1):
#>
#> Regression coefficients:
#>
#> Beta(d = 1) Beta(d = 2) Beta(d = 3)
#> 1 1.41265303 2.42222746 9.381994682
#> X^1 0.47242692 0.09217574 -0.023282898
#> X^2 -0.28135064 -0.10169173 0.018998710
#> X^3 0.04197568 0.02620151 -0.004217078
#>
#> Covariance matrix:
#>
#> 0.12667921 -0.019381009 -0.018810846
#> -0.01938101 0.109202105 -0.001402791
#> -0.01881085 -0.001402791 0.026461790
#> ------------------
#> Regime 2 (k = 2):
#>
#> Regression coefficients:
#>
#> Beta(d = 1) Beta(d = 2) Beta(d = 3)
#> 1 -3.6868321 2.4724043 7.794639
#> X^1 -6.8471097 4.6786664 14.749215
#> X^2 2.9742521 -1.4716819 -4.646020
#> X^3 -0.2449644 0.1076065 0.335142
#>
#> Covariance matrix:
#>
#> 0.22604244 -0.032716477 0.013626769
#> -0.03271648 0.032475350 0.008585402
#> 0.01362677 0.008585402 0.041960228
#> ------------------
#> Regime 3 (k = 3):
#>
#> Regression coefficients:
#>
#> Beta(d = 1) Beta(d = 2) Beta(d = 3)
#> 1 0.776245522 0.014437427 -0.1144683124
#> X^1 2.627158141 0.048519275 -0.3883099866
#> X^2 -0.255314738 -0.008318957 0.0283047828
#> X^3 0.008129981 0.000356239 -0.0007003718
#>
#> Covariance matrix:
#>
#> 0.0012000978 -0.0002523608 -0.0001992900
#> -0.0002523608 0.0006584694 0.0002391577
#> -0.0001992900 0.0002391577 0.0014228769
#> ------------------
#> Regime 4 (k = 4):
#>
#> Regression coefficients:
#>
#> Beta(d = 1) Beta(d = 2) Beta(d = 3)
#> 1 0.002894474 -0.0002900823 -0.001513232
#> X^1 0.029936273 -0.0029993910 -0.015647636
#> X^2 0.232798943 -0.0233058753 -0.121611904
#> X^3 -0.013209774 0.0019141508 0.009151938
#>
#> Covariance matrix:
#>
#> 0.21455830 -0.07328139 -0.08824736
#> -0.07328139 0.17055704 0.45218611
#> -0.08824736 0.45218611 1.76616982
#> ------------------
#> Regime 5 (k = 5):
#>
#> Regression coefficients:
#>
#> Beta(d = 1) Beta(d = 2) Beta(d = 3)
#> 1 9.416685e-05 0.0001347198 0.0005119141
#> X^1 1.259159e-03 0.0018014389 0.0068451694
#> X^2 1.265758e-02 0.0181095390 0.0688126905
#> X^3 -4.344666e-04 -0.0005920827 -0.0022723501
#>
#> Covariance matrix:
#>
#> 0.009259719 -0.000696446 0.006008102
#> -0.000696446 0.003732296 0.001056145
#> 0.006008102 0.001056145 0.016144263
mhmmr$plot(what = c("smoothed", "regressors", "loglikelihood"))In this package, it is possible to select models based on information criteria such as BIC, AIC and ICL.
The selection can be done for the two following parameters:
- K: The number of regimes;
- p: The order of the polynomial regression.
Let’s select a MHMMR model for the following multivariate time series Y:
data("toydataset")
x <- toydataset$x
y <- toydataset[, c("y1", "y2", "y3")]
matplot(x, y, type = "l", xlab = "x", ylab = "Y", lty = 1)
selectedmhmmr <- selectMHMMR(X = x, Y = y, Kmin = 2, Kmax = 6, pmin = 0, pmax = 3)
#> The MHMMR model selected via the "BIC" has K = 5 regimes
#> and the order of the polynomial regression is p = 0.
#> BIC = -3118.9815385353
#> AIC = -2963.48045745801
selectedmhmmr$plot(what = "smoothed")


