Table of contents
Introduction
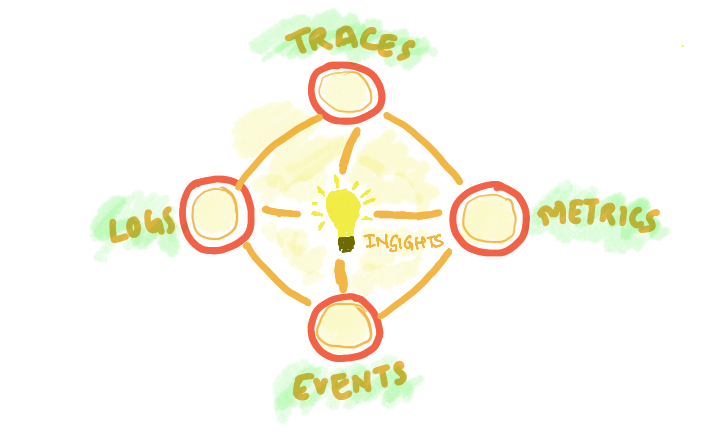
The kubernetes observability consists of 3 main pillars:
- Logs
- Metrics
- Traces
Logs are used for providing a record of events and activities within the system, such as application logs, system logs, and network logs
Metrics are used for providing a quantitative measurement of various aspects of the system, such as resource utilization, system performance, and application behavior.
Traces are used for providing visibility into the flow of requests and the dependencies between different components in a system. Tracing helps to identify performance bottlenecks and diagnose issues.
The aim of observability is to solve customer issues quickly. Creating monitoring dashboards is useless if it can’t help engineering teams quickly identify the root causes of performance issues.
A modern distributed software system has a lot of moving components. So while setting up monitoring, you might not know what answers you would need to solve an issue.
Observability enables application owners to get answers to any question that might arise while debugging application issues.
Requirments
- Kubernetes cluster
- kubectl
- helm
- Public / Private cloud
- Elastic Cloud
- Terraform
Note
In order this example to work you need kubernetes cluster up and running. In order to create it go to the terraform folder and apply all the files
terraform init
terraform apply
For obtaining yandex kubernetes config execute the following command
yc managed-kubernetes cluster get-credentials observability-k8s --externalImplementation
Logs
For setting up classical logs processing we need the following components:
- Log shipper
- Log aggregation system
- Data visualization tool
There are 2 main stacks right now for implementing Kubernetes logging: EFK and PLG. In this setup I'll show both of them, if you need more info about particular stack I suggest this comparison
EFK stack
- Fluent-bit - log shipper
- ElasticSearch - log aggregation system
- Kibana - data visualization tool
NOTE: in this setup I'll be using elastic cloud so you need to have an elastic cloud account to follow along
Don't forget to add a fluent helm repository
helm repo add fluent https://fluent.github.io/helm-charts
helm repo update
Before we jump into fluent-bit setup you need to obtain elastic cloud credentials. After your elastic deploy was created click Manage button and grab cloud-id and host (near elasticsearch instance, button Copy endpoint). Cloud auth it's a credentials from elasticsearch when cloud was originally created (csv file) separated with : (e. g. deployname:secret)

Example fluent-bit config for elastic cloud should be like this (you can find it inside helm-values folder). Fill it with your credentials and proceed to th next step

Now we can deploy our fluent-bit into the cluster with helm
helm install -n logging --create-namespace --values ./helm-values/fluent-bit-values.yaml fluent-bit fluent/fluent-bit
If we inspect fluent-bit logs, we should be able to see that fluent-bit already started some fs readers

And successfully dilivered logs to elastic cloud

Alright let's have a little demo. We're about deploy a sample perl pi job from official kubernetes docs, and deliver it's logs to the elastic cloud
Deploy a sample pi job
kubectl apply -f https://kubernetes.io/examples/controllers/job.yaml
Let's again inspect fluent-bit logs

fluent-bit already pick up our pi container logs and started another reader with id 16
After a little while logs will be delivered to the elastic cloud

PLG stack
- promtail - log shipper
- Loki - log aggregation system
- Grafana - data visualization tool
Don't forget to add a grafana helm repository
helm repo add grafana https://grafana.github.io/helm-charts
helm repo update
For installing Loki we can use loki-stack helm chart from grafana repository
helm install -n logging --create-namespace loki grafana/loki-stack --set grafana.enabled=true
After loki is up and running we can access grafana by doing port-forward
kubectl port-forward -n logging service/loki-grafana 30000:80
In order for obtaining grafana admin-password execute the following command
kubectl get secret -n logging loki-grafana -o jsonpath="{.data.admin-password}" | base64 --decode; echo
After success login to grafana go to the Explore > Loki and in field type {container="loki"} and then press Run query button.

Alright loki up and running. Let's repeat our demo from EFK stack
Deploy pi job
kubectl apply -f https://kubernetes.io/examples/controllers/job.yaml
And if we execute {job="default/pi"} we can see that loki shipped logs from pi job successfully

Bonus
Repeat the steps from EFK repository and upgrade loki helm release using this command
helm upgrade -n logging loki grafana/loki --set grafana.enabled=true,fluent-bit.enabled=true,promtail.enabled=falseNow we disable promtail and enable fluent-bit collector. After a little while we have fluent-bit and Loki up and running in the cluster

Optional: update fluent-bit index to the fluent_bit_kubernetes_logs and upgrade it using command down below
helm upgrade -n logging --values ./helm-values/fluent-bit-values.yaml fluent-bit fluent/fluent-bitNow let's query our Elastic Cloud and Loki

Metrics
For setting up classical metrics monitoring we need the following components:
- Prometheus
- Grafana
- Alertmanager
- Exporters (node-exporter, kube-state-metrics, etc.)
In this guide I'll cover 2 ways to setup metrics in k8s:
NOTE: For both methods you need to add prometheus-community helm repository
helm repo add prometheus-community https://prometheus-community.github.io/helm-charts
helm repo update
kube-prometheus-stack
By default besides Prometheus kube-prometheus-stack chart installs additional, dependent charts:
- prometheus-community/kube-state-metrics
- prometheus-community/prometheus-node-exporter
- prometheus-community/alertmanager
- prometheus-community/pushgateway
- grafana/grafana
For installing kube-prometheus-stack run the the following command:
helm install prometheus-commnunity -n monitoring --create-namespace prometheus-community/kube-prometheus-stackThe output should be like this:

List of availiable svc

Now we can port-forward to grafana using kubectl
kubectl port-forward -n monitoring service/prometheus-commnunity-grafana 30000:80
After that we can go to the http://localhost:30000 and see grafana up and running

The prometheus-community/grafana secret contains some fields that we need to decode with following commands

kubectl get secret prometheus-commnunity-grafana -n monitoring -o jsonpath={".data.admin-user"} | base64 --decode; echo
kubectl get secret prometheus-commnunity-grafana -n monitoring -o jsonpath={".data.admin-password"} | base64 --decode; echo
Nice! Now we're successfully logged in and can see the grafana main page

By default kube-prometheus-stack provides a ton of predefined grafana dashboards (Home > Dashboards)

For example let's inspect Kubernetes / API server group

For more info and availiable options you can visit kube-prometheus-stack artifacthub here
prometheus-community
By default besides Prometheus prometheus-community/prometheus chart installs additional, dependent charts:
- prometheus-community/kube-state-metrics
- prometheus-community/prometheus-node-exporter
- prometheus-community/alertmanager
- prometheus-community/pushgateway
The installation of prometheus-community/prometheus almost the same but we need to install grafana separately
Grafana helm repo
helm repo add grafana https://grafana.github.io/helm-chartsFor installing prometheus community execute the following commands:

For accessing prometheus ui we can do port-forward like this
kubectl port-forward -n monitoring service/prometheus-server 30000:80
And then access prometheus on http://localhost:30000

The next step is to install grafana from grafana/grafana repo (NOTE: execute the kubectl get secret as shown in grafana output for obtaining admin passoword)
helm install -n monitoring grafana grafana/grafana
And do port-forward
kubectl port-forward -n monitoring service/grafana 30000:80After port-forwarding by entering http://localhost:30000 we can see grafana login screen

In order to create new datasource and add dashboards follow this steps:
- Go to the Home > Connections > Type
prometheusand select it

- Click
Create a Prometheus datasource

- Configure Prometheus datasource
In host field enter your local k8s cluster dns for prometheus (e. g. http://prometheus-server.monitoring.svc.cluster.local)

- Scroll all the way down and click
Save & test

- Go to the Home > Dashboards and click New > Dashboards

- Select
Prometheusdata source

- Configure dashboard by selecting metric type and chart type

- Save it

That's all, now we have prometheus / grafana up and running inside a kubernetes envirement.
This chart isn't contains grafana and ton of grafana dashboards as kube-prometheus-stack do, but still it's an a good option
Traces
Add jaeger helm repository:
helm repo add jaegertracing https://jaegertracing.github.io/helm-chartsJaeger
For tracing setup I'll be using jaeger as trace exporter. All availiable exporters and also docs for OpenTelemetry you can find here.
NOTE: Jaeger has 2 main data stores ElasticSearch and Cassandra (default). You can use either Cassandra or ElasticSearch data store. In this setup I'll be using Cassandra as main data store. For more info see: https://artifacthub.io/packages/helm/jaegertracing/jaeger#installing-the-chart-using-a-new-elasticsearch-cluster
For installing jaeger run the following command:
helm install jaeger jaegertracing/jaeger
After a little while all pods should be up and running

For accessing jaeger ui do port-forward by executing commands down below
export POD_NAME=$(kubectl get pods --namespace default -l "app.kubernetes.io/instance=jaeger,app.kubernetes.io/component=query" -o jsonpath="{.items[0].metadata.name}")
kubectl port-forward --namespace default $POD_NAME 8080:16686 1>/dev/null &
Now you can access jaeger ui on localhost:8080

For example application we deploy my demo python app. Clone it and apply all manifests using Kustomize
git clone https://github.com/fayvori/python-otel-demo.git
cd python-otel-demo
kubectl create namespace otel-demo
kubectl apply -n otel-demo -k manifests
This is simple flask application which is returned dice roll on path /rolldice. We also port-forward it to our local host
kubectl port-forward -n otel-demo svc/flask-otel-service 5000:5000 2>/dev/null &
Go to localhost:5050/rolldice and refresh page couple times. Also we can simulate timeouts by providing ?sleep argument. (e.g. localhost:5050/rolldice?sleep={duration}, default is 0)
Return to jaeger ui and select python.dice in Service field and do_roll in Operation field

Our traces successfully dilivered to the Jaeger.
Don't forget to kill all the background jobs when you're done
kill %1
kill %2