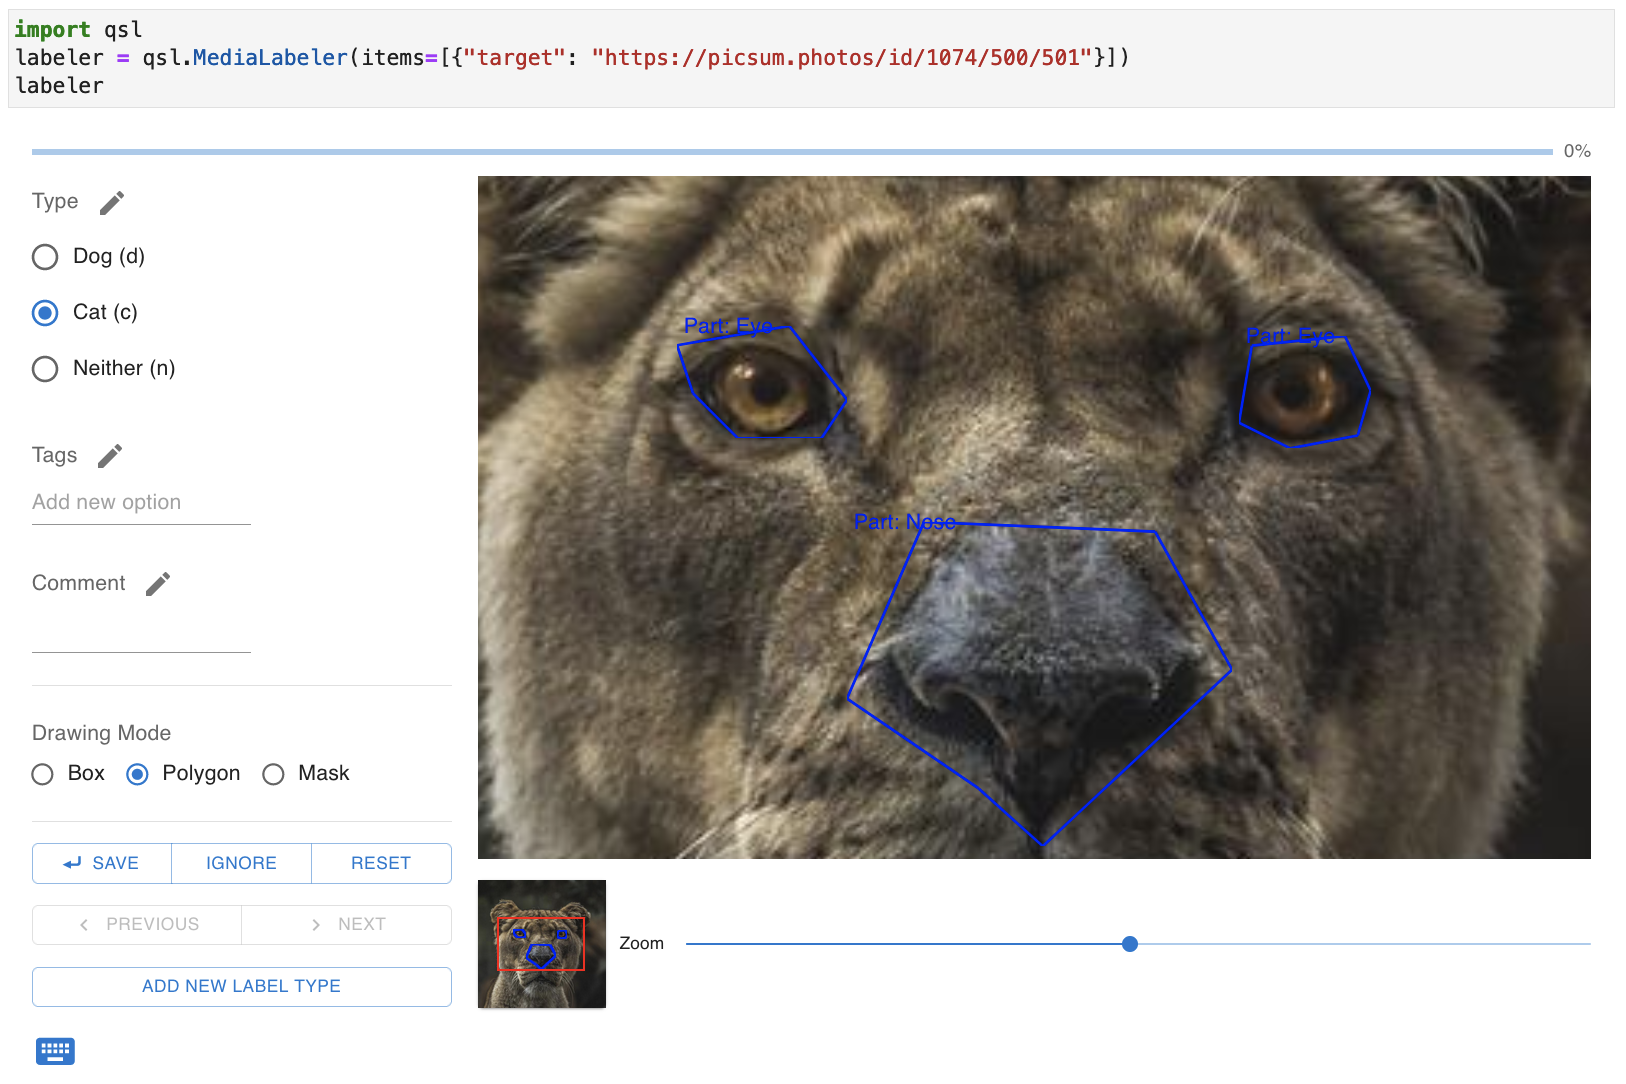
QSL is a simple, open-source media labeling tool that you can use as a Jupyter widget. More information available at https://qsl.robinbay.com. It supports:
- Bounding box, polygon, and segmentation mask labeling for images and videos (with support for video segments).
- Point and range-based time-series labeling.
- Automatic keyboard shortcuts for labels.
- Loading images stored locally, on the web, or in cloud storage (currently only AWS S3).
- Pre-loading images in a queue to speed up labeling.
Please note that that QSL is still under development and there are likely to be major bugs, breaking changes, etc. Bug reports and contributions are welcome!
Get started by installing using pip install qsl. Label a folder of images and save the labels to JSON using the standalone interface using qsl label labels.json images/*.jpg. Check out the Colab Notebook for an example of how to use the Jupyter Widget.
Each example below demonstrates different ways to label media using the tool. At the top of each are the arguments used to produce the example.
- To use the example with the Jupyter Widget, use
qsl.MediaLabeler(**params) - To use the example with the command-line application, use
open("project.json", "w").write(json.dumps(params))and then runqsl label project.json.
import qsl

params = dict(
    config={
        "image": [
            {"name": "Location", "multiple": False, "options": [{"name": "Indoor"}, {"name": "Outdoor"}]},
            {"name": "Flags", "multiple": True, "freeform": True},
            {"name": "Type", "multiple": False, "options": [{"name": "Cat"}, {"name": "Dog"}]},
        ],
        "regions": [
            {"name": "Type", "multiple": False, "options": [{"name": "Eye"}, {"name": "Nose"}]}
        ]
    },
    items=[
        {"target": "https://picsum.photos/id/1025/500/500", "defaults": {"image": {"Type": ["Dog"]}}},
    ],
)
qsl.MediaLabeler(**params)
import qsl

params = dict(
    config={
        "image": [
            {"name": "Location", "multiple": False, "options": [{"name": "Indoor"}, {"name": "Outdoor"}]},
            {"name": "Flags", "multiple": True, "freeform": True},
        ],
        "regions": [
            {"name": "Type", "multiple": False, "options": [{"name": "Eye"}, {"name": "Nose"}]}
        ]
    },
    items=[
        {
            "target": "http://commondatastorage.googleapis.com/gtv-videos-bucket/sample/BigBuckBunny.mp4",
            "type": "video",
        }
    ],
)
qsl.MediaLabeler(**params)
import qsl

params = dict(
    config={
        "image": [
            {"name": "Type", "multiple": False, "options": [{"name": "Cat"}, {"name": "Dog"}]},
            {"name": "Location", "multiple": False, "options": [{"name": "Indoor"}, {"name": "Outdoor"}]},
            {"name": "Flags", "multiple": True, "freeform": True},
        ],
        "regions": [
            {"name": "Type", "multiple": False, "options": [{"name": "Eye"}, {"name": "Nose"}]}
        ]
    },
    items=[
        {"target": "https://picsum.photos/id/1025/500/500", "defaults": {"image": {"Type": ["Dog"]}}},
        {"target": "https://picsum.photos/id/1062/500/500", "metadata": {"source": "picsum"}},
        {"target": "https://picsum.photos/id/1074/500/500"},
        {"target": "https://picsum.photos/id/219/500/500"},
        {"target": "https://picsum.photos/id/215/500/500"},
        {"target": "https://picsum.photos/id/216/500/500"},
        {"target": "https://picsum.photos/id/217/500/500"},
        {"target": "https://picsum.photos/id/218/500/500"},
    ],
    batchSize=2
)
qsl.MediaLabeler(**params)
import qsl
import numpy as np

x = np.linspace(0, 2 * np.pi, 100)
params = dict(
    config={
        "image": [
            {"name": "Peaks", "multiple": True},
            {"name": "A or B", "freeform": True},
        ]
    },
    items=[
        {
            "target": {
                "plots": [
                    {
                        "x": {"name": "time", "values": x},
                        "y": {
                            "lines": [
                                {
                                    "name": "value",
                                    "values": np.sin(x),
                                    "color": "green",
                                    "dot": {"labelKey": "Peaks"},
                                }
                            ]
                        },
                        "areas": [
                            {
                                "x1": 0,
                                "x2": np.pi,
                                "label": "a",
                                "labelKey": "A or B",
                                "labelVal": "a",
                            },
                            {
                                "x1": np.pi,
                                "x2": 2 * np.pi,
                                "label": "b",
                                "labelKey": "A or B",
                                "labelVal": "b",
                            },
                        ],
                    }
                ],
            },
            "type": "time-series",
        }
    ],
)
qsl.MediaLabeler(**params)
params = dict(
    items=[
        {
            "type": "image-stack",
            "target": {
                "images": [
                    {
                        "name": image["name"],
                        "target": image["filepath"],
                        "transform": cv2.getRotationMatrix2D(
                            center=(0, 0), angle=image["angle"], scale=1
                        ),
                    }
                    for image in qsl.testing.files.ROTATED_TEST_IMAGES
                ]
            },
        }
    ],
    config={
        "image": [
            {
                "name": "Type",
                "multiple": False,
                "options": [{"name": "Cat"}, {"name": "Dog"}],
            },
            {
                "name": "Location",
                "multiple": False,
                "options": [{"name": "Indoor"}, {"name": "Outdoor"}],
            },
            {"name": "Flags", "multiple": True, "freeform": True},
        ],
        "regions": [
            {
                "name": "Type",
                "multiple": False,
                "options": [{"name": "Eye"}, {"name": "Nose"}],
            }
        ],
    },
)
qsl.MediaLabeler(**params)qsl.MediaLabeler accepts the following arguments:
config[required]: The configuration to use for labeling. It has the following properties.image[required]: The labeling configuration at the image-level for images, the frame-level for vidos, and the time-series level of time series targets. It is a list of objects, each of which have the following properties:name[required]: The name for the label entry.displayName: The displayed name for the label entry in the UI. Defaults to the same value asname.multiple: Whether the user can supply multiple labels for this label entry. Defaults tofalse.freeform: Whether the user can write in their own labels for this entry. Defaults tofalse.required: Whether the user is required to provide a label for this entry.options: A list of options that the user can select from -- each option has the following properties.name[required]: The name for the option.displayName: The displayed name for the option. Defaults to the same value asname.shortcut: A single-character that will be used as a keyboard shortcut for this option. If not set,qslwill try to generate one on-the-fly.
regions[required]: The labeling configuration at the region-level for images and video frames. It has no effect oftime-seriestargets. It is a list of objects with the same structure as that of theimagekey.
items[required]: A list of items to label, each of which have the following properties.jsonpath: The location in which to save labels. If neither this property nor the top-leveljsonpathparameters are set, you must get the labels fromlabeler.items.type[optional, default=image]: The type of the labeling target. The options areimage,video, andtime-series.metadata: Arbitrary metadata about the target that will be shown alongside the media and in the media index. Provided as an object of string keys and values (non-string values are not supported).target[optional]: The content to actually label. The permitted types depend on thetypeof the target.- If
typeisvideo,targetcan be:- A string filepath to a video.
- A string URL to a video (e.g.,
https://example.com/my-video.mp4) - A string URL to an S3 resource (e.g.,
s3://my-bucket/my-video.mp4) - A string representing a base64-encoded file (e.g.,
data:image/png;charset=utf-8;base64,...)
- If
typeisimage,targetcan be any of the image types (filepath, URL, base64-encoded file). In addition it can also be:- A
numpyarray with shape(height, width, 3). The final axis should be color in BGR order (i.e., OpenCV order).
- A
- If
typeistime-series, the only permitted type is an object with the following keys:plots[required]: A list of objects representing plots, each of which has the following properties:x[required]: An object with properties:name[required]: The name used for the x-axis.values[required]: An array of numerical values.
y[required]: An object with properties:lines[required]: An array of objects, each with properties:name[required]: The name for this line, used for drawing a legend.values[required]: An array of numerical values for this line. It must be the same length asx.values.color[optional]: A string representing a color for the line. Defaults toblue.dot[optional]: An object with the following properties, used to configure what happens when a user clicks on a data point.labelKey[required]: The image-level label to which clicked values should be applied. If a user clicks a data point, the x-coordinate for the clicked dot will be set as the label inlabelKey. If that label has"multiple": True, then it is appended to a list of values. If it is"multiple": False, then the clicked dot x-coordinate will replace the value inlabelKey.
areas[optional]: A list of clickable areas to draw onto the plot, each of which should have the following properties:x1[required]: The starting x-coordinate for the area.x2[required]: The ending x-coordinate for the area.labelKey[required]: The label entry to which this area will write when the user clicks on it.labelVal[required]: The value to which the label entry will be assigned when the user clicks on it.label[required]: The text label that will appear on the area.
- If
labels: Labels for the target. When the user labels the item in the interface, this property will be modified.- For images, it has the following properties:
image: Image-level labels for the image of the form{[name]: [...labels]}wherenamecorresponds to thenameof the corresponding entry in theconfig.imagearray.polygons: Polygon labels for the image of the form:points[required]: A list of{x: float, y: float}values.xandyrepresent percentage of width and height, respectively.labels: An object of the same form as theimagekey above.
boxes: Rectilinear bounding box labels for the image of the form:pt1[required]: The top-left point as an{x: float, y: float}object.pt2[required]: The bottom-right point. Same format aspt1.labels: An object of the same form as theimagekey above.
masks: Segmentation masks of the form:dimensions[required]: The dimensions of the segmentation mask as awidth: int, height: intobject.counts[required]: A COCO-style run-length-encoded mask.
- For videos, it is an array of objects representing frame labels. Each object has the form:
timestamp[required]: The timestamp in the video for the labeled frame.end: The end timstamp, for cases where the user is labeling a range of frames. They can do this by alt-clicking on the playbar to select an end frame.labels: Same as the imagelabelsproperty, but for the timestamped frame (i.e., an object withimage,polygons,boxes, andmasks).
- For images, it has the following properties:
defaults: The default labels that will appear with given item. Useful for cases where you want to present a default case to the user that they can simply accept and move on. Has the same structure asdefaults.
allowConfigChange: Whether allow the user to change the labeling configuration from within the interface. Defaults to true.maxCanvasSize: The maximum size for drawing segmentation maps. Defaults to 512. Images larger than this size will be downsampled for segmentation map purposes.maxViewHeight: The maximum view size for the UI. Defaults to 512. You will be able to pan/zoom around larger images.mode: The style in which to present the UI. Choose between "light" or "dark". Defaults to "light".batchSize: For images, the maximum number of images to show for labeling simultaneously. Any value greater than 1 is incompatible with any configuration that includesregions. Videos and time series will still be labeled one at a time.jsonpath: The location in which to save labels and configuration for this labeler. If neither this property nor the top-leveljsonpathparameters are set, you must get the labels fromlabeler.items. Note that if the file at this path conflicts with any of the settings provided as arguments, the settings in the file will be used instead.
You can launch the same labeling interface from the command line using qsl label <project-json-file> <...files>. If the project file does not exist, it will be created. The files you provide will be added. If the project file already exists, files that aren't already on the list will be added. You can edit the project file to modify the settings that cannot be changed from within the UI (i.e., allowConfigChange, maxCanvasSize, maxViewHeight, mode, and batchSize).
- Create a local development environment using
make init - Run widget development with live re-building using
make develop - Run a Jupyter Lab instance using
make lab. Changes to the JavaScript/TypeScript require a full refresh to take effect.