In this article we will parse the logs records generated by the Suricata IDS. We already have our graylog server running and we will start preparing the terrain to capture those logs records.
We now create the Suricata index in System/Indices
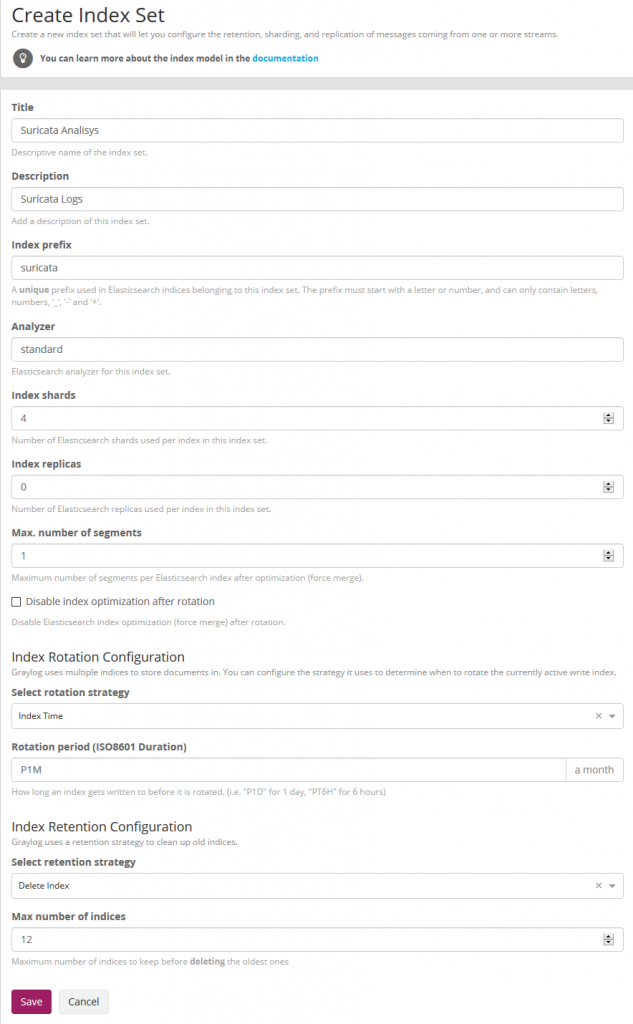
Index shard 4 and Index replicas 0, the rotation of the Index time index and the retention can be deleted, closure of an index according to the maximum number of indices or doing nothing. In my case, I set it to rotate monthly and eliminate the indexes after 12 months. In short there are many ways to establish the rotation. This index is created immediately.

As we will see later in the IDS Suricata we will register their logs in JSON format which made the construction of the extractors in the Graylog much easier in this format. The content pack includes Input of type beats, extractors, lookup tables, Data adapters for lockup tables and Cache for lookup tables. . To download these files we install git to clone the repository.
#apt-get install git
and then we cloned it
#git clone https://github.com/opc40772/suricata-graylog
We will locate the CSV file of the lookup tables to later convert the number of ports to services name. From this git that you just cloned, we selected the service-names-port-numbers.csv file and copied it to /etc/graylog/server.
#cp service-names-port-numbers.csv /etc/graylog/server
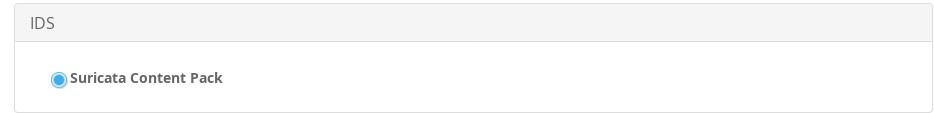
We now import the file from the Content Pack folder and for them we select in the System/Content Packs the option Import content packs to upload the file.

As we see, it added to the list
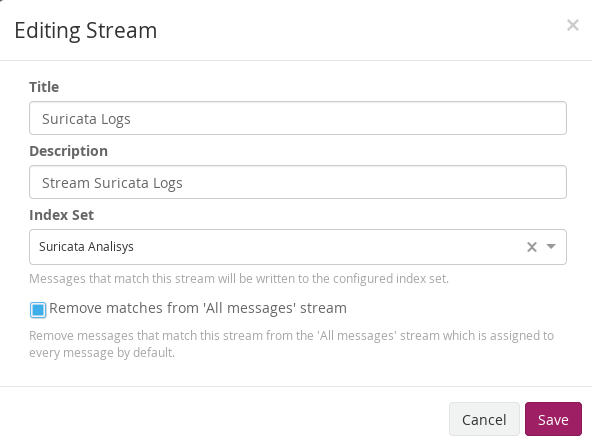
We edit the stream of Suricata in Stream to associate the index that we created initially. We mark that it eliminates the coincidences for the default stream All message so that only it stores it in the index of Suricata.
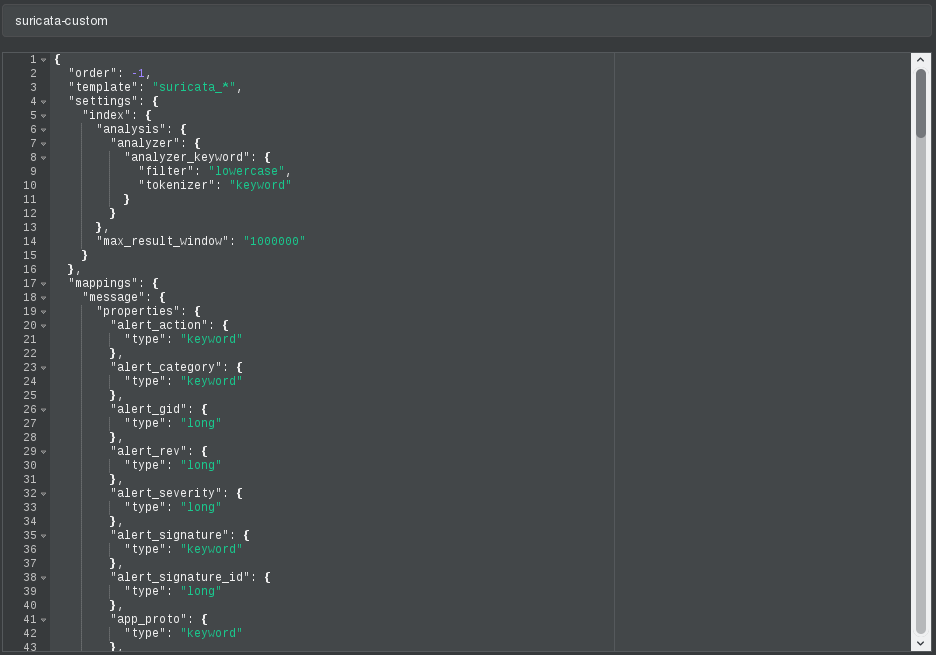
As previously explained by default, graylog for each index that is created generates its own template and applies it every time the index rotates. If we want our own templates we must create them in the same elasticsearch. We will add the field real_timestamp that will be useful when using grafana and we also convert the geoip type dest_ip_geolocation and src_ip_geolocation to type geo_point to be used in the World Map panels since graylog does not use this format.
In the git that we cloned already is this personalized template that we are talking about and that we are going to import into elasticsearch through the brain. We are going to more/index template
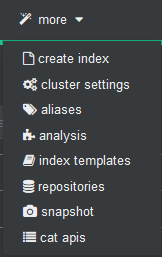
We create a new template
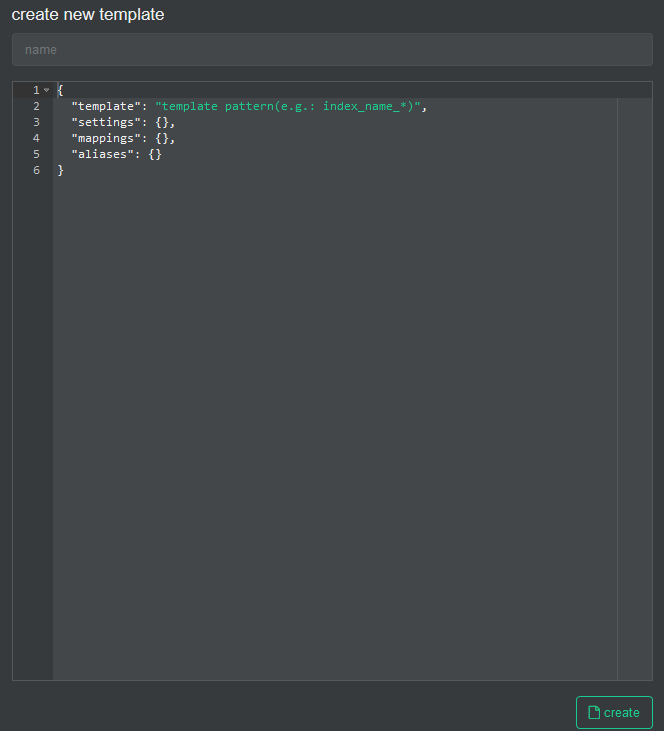
In the name we fill it with suricata-custom and open the git file that has the template and paste its content here.
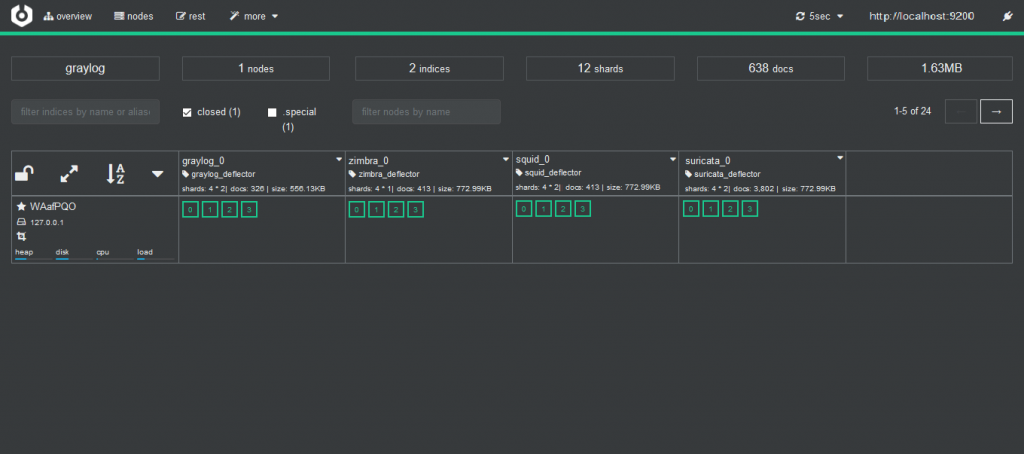
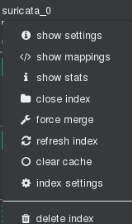
Now we will stop the graylog service to proceed to eliminate the index through brain.
#systemctl stop graylog-server.service
In brain we stand on top of the index and unfold the options and select delete index.
We start the graylog service again and this will create the index with this template.
#systemctl start graylog-server.service
Our Suricata IDS is running as a service in the Pfsense firewall and is already configured.
Preparing pfsense server.
Determine the Filebeat package for FreeBSD: The packages depend on the running version of freeBSD, and this depends on the version of pfSense. pfSense 2.3.x is based on a freeBSD 10. pfSense 2.4.x is based on freeBSD 11.1 If you are using pfSense 2.3.4 the list of current native packages is available here: http://pkg.freebsd.org/freebsd:10:x86:64/latest/All/ If you are using pfSense 2.4 (published in October 2017) the list of current native packages is available here: http://pkg.freebsd.org/FreeBSD:11:amd64/latest/All/
Search the list to determine the available Filebeats package. At the time of writing, the available version of the Filebeats package is 6.2.2 and the package file is called beats-6.2.2.txz
Installing the package: Use your terminal program of choice for SSH to access PFSense as the administrator user and choose option 8 to enter the freeBSD shell Install the package using the following command:
#pkg add http://pkg.freebsd.org/FreeBSD:11:amd64/latest/All/beats-6.2.2.txz
The package must be installed in /usr/local
Executable in: /usr/local/sbin/filebeat
Configuration file in: /usr/local/etc/filebeat.yml
The JSON (JavaScript Object Notation) format is a data format that is readable by humans and easy to analyze. It uses name / value pairs to describe fields, objects and data matrices, which makes it ideal for transmitting data, such as log files, where the format of the data and the relevant fields will likely be different between services and systems. When using JSON format records, it means that we will not have to spend much effort configuring Graylog to analyze strings and fields that we would probably need to do if we were using a CSV or other format for the registration data. It is possible to configure the registry at the level of each interface within Suricata. Within the Suricata interfaces screen, click to edit the relevant interface (In my case WAN) for which you want to collect logs data and scroll down to the 'Logging Settings' section shown here (pfSense Version 2.4.2):
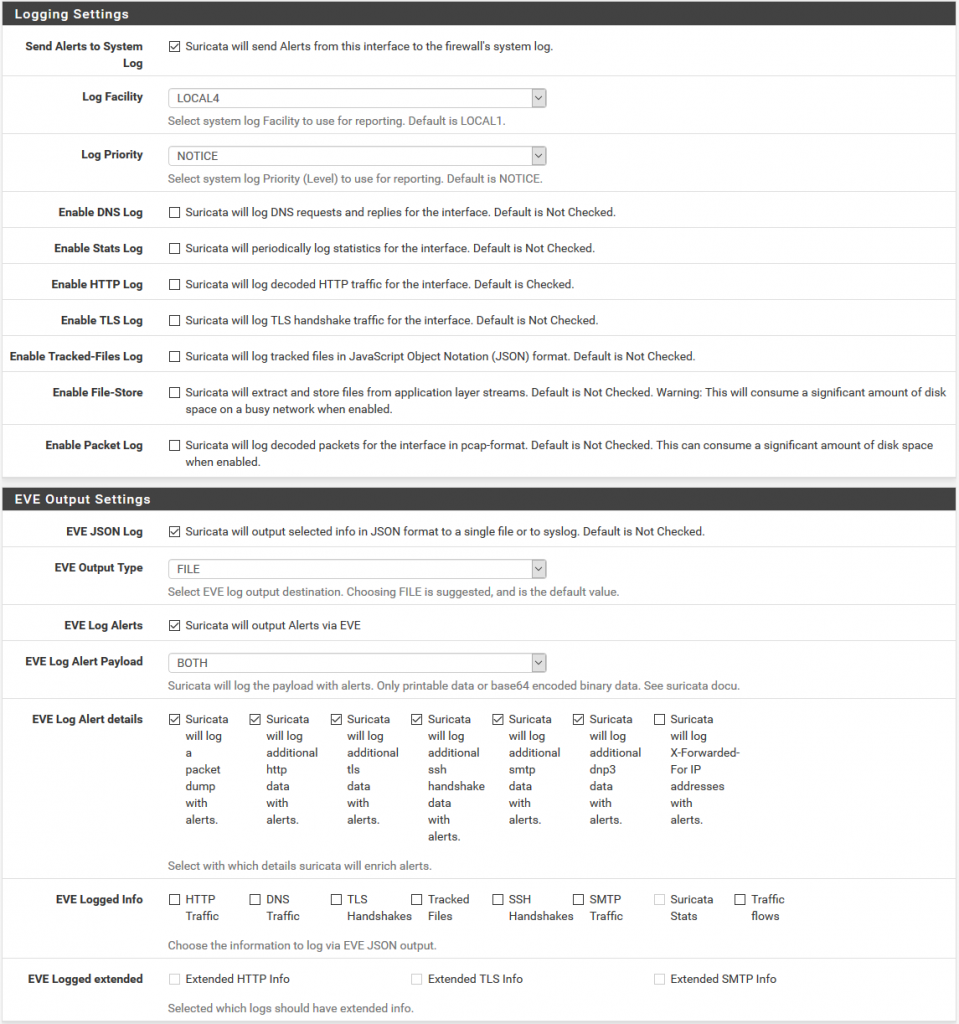
The relevant configuration is:
- EVE JSON Log: Mark
- EVE Output Type: Select 'FILE'
- EVE Log Alerts: Mark
- EVE Log Alert Payload
- EVE Log Alert details: Mark as shown in the previous image.
The other configurations are not relevant. Once you have configured the previous configurations, do not forget to click on the 'Save' button at the bottom of the screen.
The records can be found in a subdirectory relevant to their interface within /var/logs/suricata/. The file eve.json is the file that interests us.
Confirm that you are receiving data using cat or tail in the file. If the file is not being completed, you may need to restart the Suricata service from the pfSense service control panel.
The first thing to do is create a directory for Filebeat to place its own logs. The configuration file that we will create will ensure that Filebeat registers at this location to provide us with some useful data for debugging:
#mkdir /var/log/filebeat
Next, create a file file called filebeat.yml that contains the following in: /usr/local/etc/filebeat.yml. Be sure to use spaces, instead of tab characters.
#------------------------- File prospectors --------------------------------
 filebeat.prospectors:
  - input_type: log
    paths:
    - /var/log/suricata/*/eve.json*
    fields_under_root: true
    fields:
      type: "suricataIDPS"
  	  tags: ["SuricataIDPS","JSON"]
#----------------------------- Logstash output --------------------------------
 output.logstash:
  hosts: ["192.168.1.123:5042"]
#---------------------------- filebeat logging -------------------------------
 logging.to_files: true
 logging.files:
   path: /var/log/filebeat
   name: filebeat.log
   keepfiles: 7
The syntax of the actual configuration file is available on the Elastic website but this configuration file does the following:
- Process all files in subdirectories in /var/log/suricata/ that match the file specification: eve.json * The files will be log files
- For each log entry, add the type field at the root level with the value of 'suricataIDPS'; this will be used to determine the processing within Graylog once the file reaches our destination server.
- For each record entry, add the labels 'SuricataIDPS' and 'JSON'. These are arbitrary tags added to the records for use in queries in Graylog.
- Send the events to Graylog at 192.168.1.123:5044
- The log files in /var/log/filebeat/filebeat.log and do not save more than 7 files of them.
Test the configuration:
#/usr/local/sbin/filebeat -c /usr/local/etc/filebeat.yml -configtest
Config OK
This should indicate if there is a problem with the configuration file. Note that the configuration file is sensitive to indentation tabs, so if you have used these instead of spaces, an error may be generated and the problem will not be obvious.
Test run:
#/usr/local/sbin/filebeat -c /usr/local/etc/filebeat.yml -N
This will execute filebeat and process the Suricata records. the -N option prevents events from being sent to the destination server.
To see what is happening.
#tail -f /var/log/filebeat/filebeat.log
The installer of the beats package was good enough to create some rc.d init scripts for Filebeat in /usr/local/etc/rc.d
Because this is pfSense and, therefore, the FreeBSD implementation scripts customized in this directory must have the .sh file extension to run. Copy the filebeat script:
#cp /usr/local/etc/rc.d/filebeat/usr/local/etc/rc.d/filebeat.sh
If you take a look at the script, it indicates that some configurations are configured in /etc/rc.conf
Again, due to the personalization of pfSense, this file is overwritten at startup and should not be edited. However, the creation of a file /etc/rc.conf.local will take care of us. Set filebeat to boot at startup and specify the configuration file as follows:
#echo "filebeat_enable=yes" >> /etc/rc.conf.local
#echo "filebeat_conf=/usr/local/etc/filebeat.yml" >> /etc/rc.conf.local
This will cause Filebeat to boot at startup. Restart your pfSense firewall and verify with PS:
#ps aux | grep beat
root 64932 0.0 0.1 10368 2040 - Is 19Mar18 0: 00.00 daemon: / usr / local / sbin / filebeat [65093] (daemon)
root 65093 0.0 0.9 54984 18888 - I 19Mar18 5: 37.31 / usr / local / sbin / filebeat -path.home / var / db / beats / filebeat -path.conf
root 19915 0.0 0.1 14728 2344 1 S + 21:17 0: 00.00 grep beat
This is as simple as, from an SSH shell, issue the following command. A result similar to the following will be displayed.
#tail -f /var/log/filebeat/filebeat.log
One of the advantages of Filebeat is that it keeps track of which files and events it has processed and which have been sent and confirmed by the destination in this Graylog gas. This tracking is stored in a registry file called registry. This is excellent in production, but it is likely that you will have to send the same registers several times during the configuration of the solution or also in case of voltage drops and the pfsense that abruptly causes the filebeat error when starting due to the file is abruptly turned off corrupt registry. To do this, you need to delete the Filebeat registry and restart the process. To accomplish this, do the following:
Stop the filebeat service
#/usr/local/etc/rc.d/filebeat.sh stop
Delete the registry file:
#rm /var/db/beats/filebeat/data/registry
We started filebeat
#/usr/local/etc/rc.d/filebeat.sh start
Again, the log records will be sent back to the destination, which in this case is our Graylog.
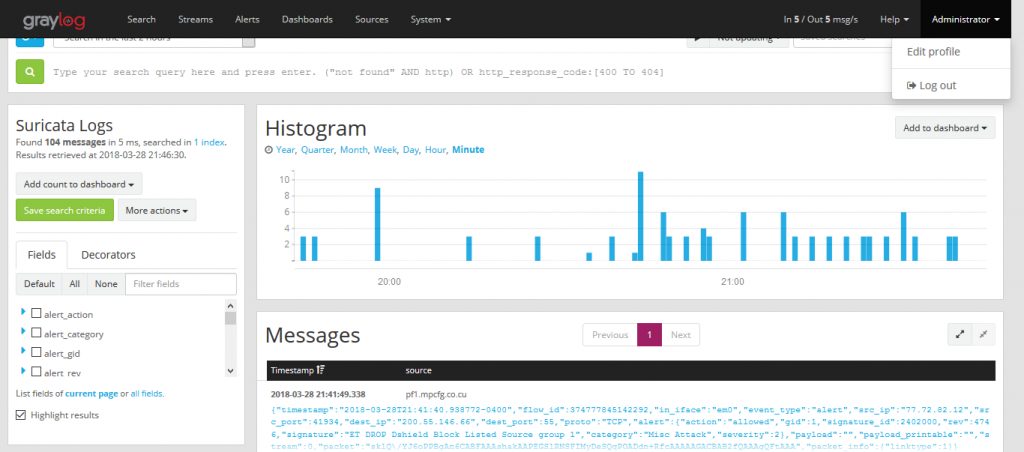
Now in graylog we select the Suricata stream and we will see how it is logs messages creating the fields.
#Grafana
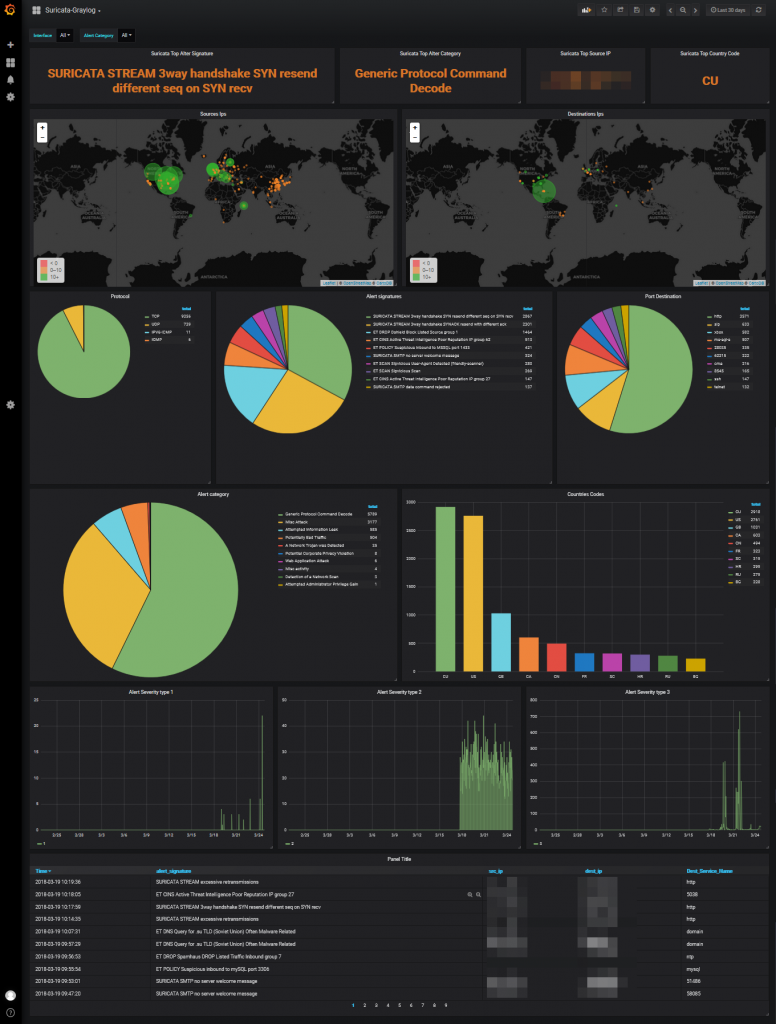
Graylog dashboards do not offer the possibilities to my way of seeing that grafana has so our dashboard will do in grafana
We create the datasource in grafana which we will name Suricata-graylog

I share with you a predesigned dashboard in the official grafana site which could be imported.
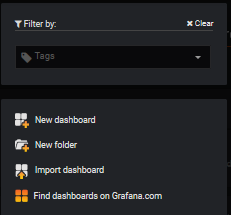
We select Import dashboard
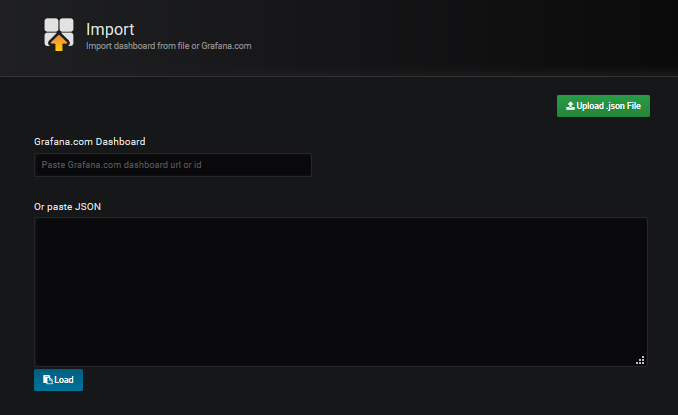
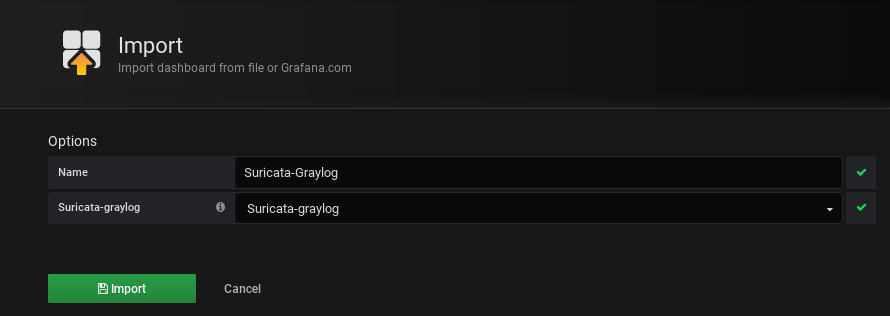
We upload the downloaded file Upload .json file and associate it with the datasource created for it.
We can already see the dashboard in action.