WeatherAware is a web application for monitoring key weather data at any location in the United States.
It is a fork of Alex Gaiduk's AirAware application, which is used for pollution monitoring.
Screencast: Link here
Pressure, temperature, wind, and humidity are primary factors determining the weather in a given location.
Atmospheric pressure is the downward force exerted by the air as a result of gravity. Low pressure systems bring clouds, wind, and precipitation, while high-pressure systems bring fairer, calmer weather.
Temperature measures the average speed of molecules in a substance. Temperature varies across the globe due to latitude, geography, ocean currents, and winds.
Wind is the movement of air across Earth's surface as the planet is unevenly heated by the sun. Winds blow to restore the balance of temperature and pressure across the globe.
Humidity measures the water vapor content of the air. Humidity helps determine precipitation and the volume of cloud formation.
WeatherAware displays the vital monthly weather data for any United States location. For the chosen location, a user can download years of historical hourly data. The app could be useful for homeowners planning a move to a new location, pilots looking to understand the weather patterns in their flight path, or construction companies looking to determine the number of workable days in the year.
The complete measurement data is available from the EPA for the years 1980-2021, measured every hour at more than 30,000 locations across US. The files are ~6GB/year for years after 2010.
To extract data, files are downloaded into an Amazon S3 bucket, then loaded into Spark's RDD object.
The main data transformation in this project is calculation of air quality levels at arbitrary grid points. The grid for WeatherAware contains more than 100,000 points, ensuring sufficiently fine mesh, with any arbitrary U.S. address being at most ~5-10 miles away from one of the grid points. Computing weather measurements at grid points is a spatial interpolation problem with several common solutions [link]. WeatherAware uses inverse distance weighting to map sensor data to grid points.
Cleaned monthly average measurements are loaded into the PostgreSQL database with PostGIS extension for location-based search. Detailed hourly measurements are loaded into a Cassandra database for historical data retrieval.
Interpolation of geospatial data is computationally expensive: for each time step, around 50 million unique combinations of stations and grid points need to be considered for each weather measurement. In addition, each of these calculations involves computing distance between two geographical points using five trigonometric function estimations. Doing these calculations on-the-fly would result in unacceptably long wait times for users. To cut the computational cost, WeatherAware precomputes distances between the grid points and stations.
Once the computation for each moment of time is complete, the resulting grid needs to be stored in the database as a time series. This means storing ~100,000 points for every hour in the day, for almost 40 years of observation history. Given the large amount of data, WeatherAware needs a way to efficiently locate the grid points closest to a given address.
To solve these challenges, WeatherAware uses a PostgreSQL database with PostGIS extension is used for quick location lookup and monthly historical data. A Cassandra distributed database is used for full historical data lookup at an hourly resolution.
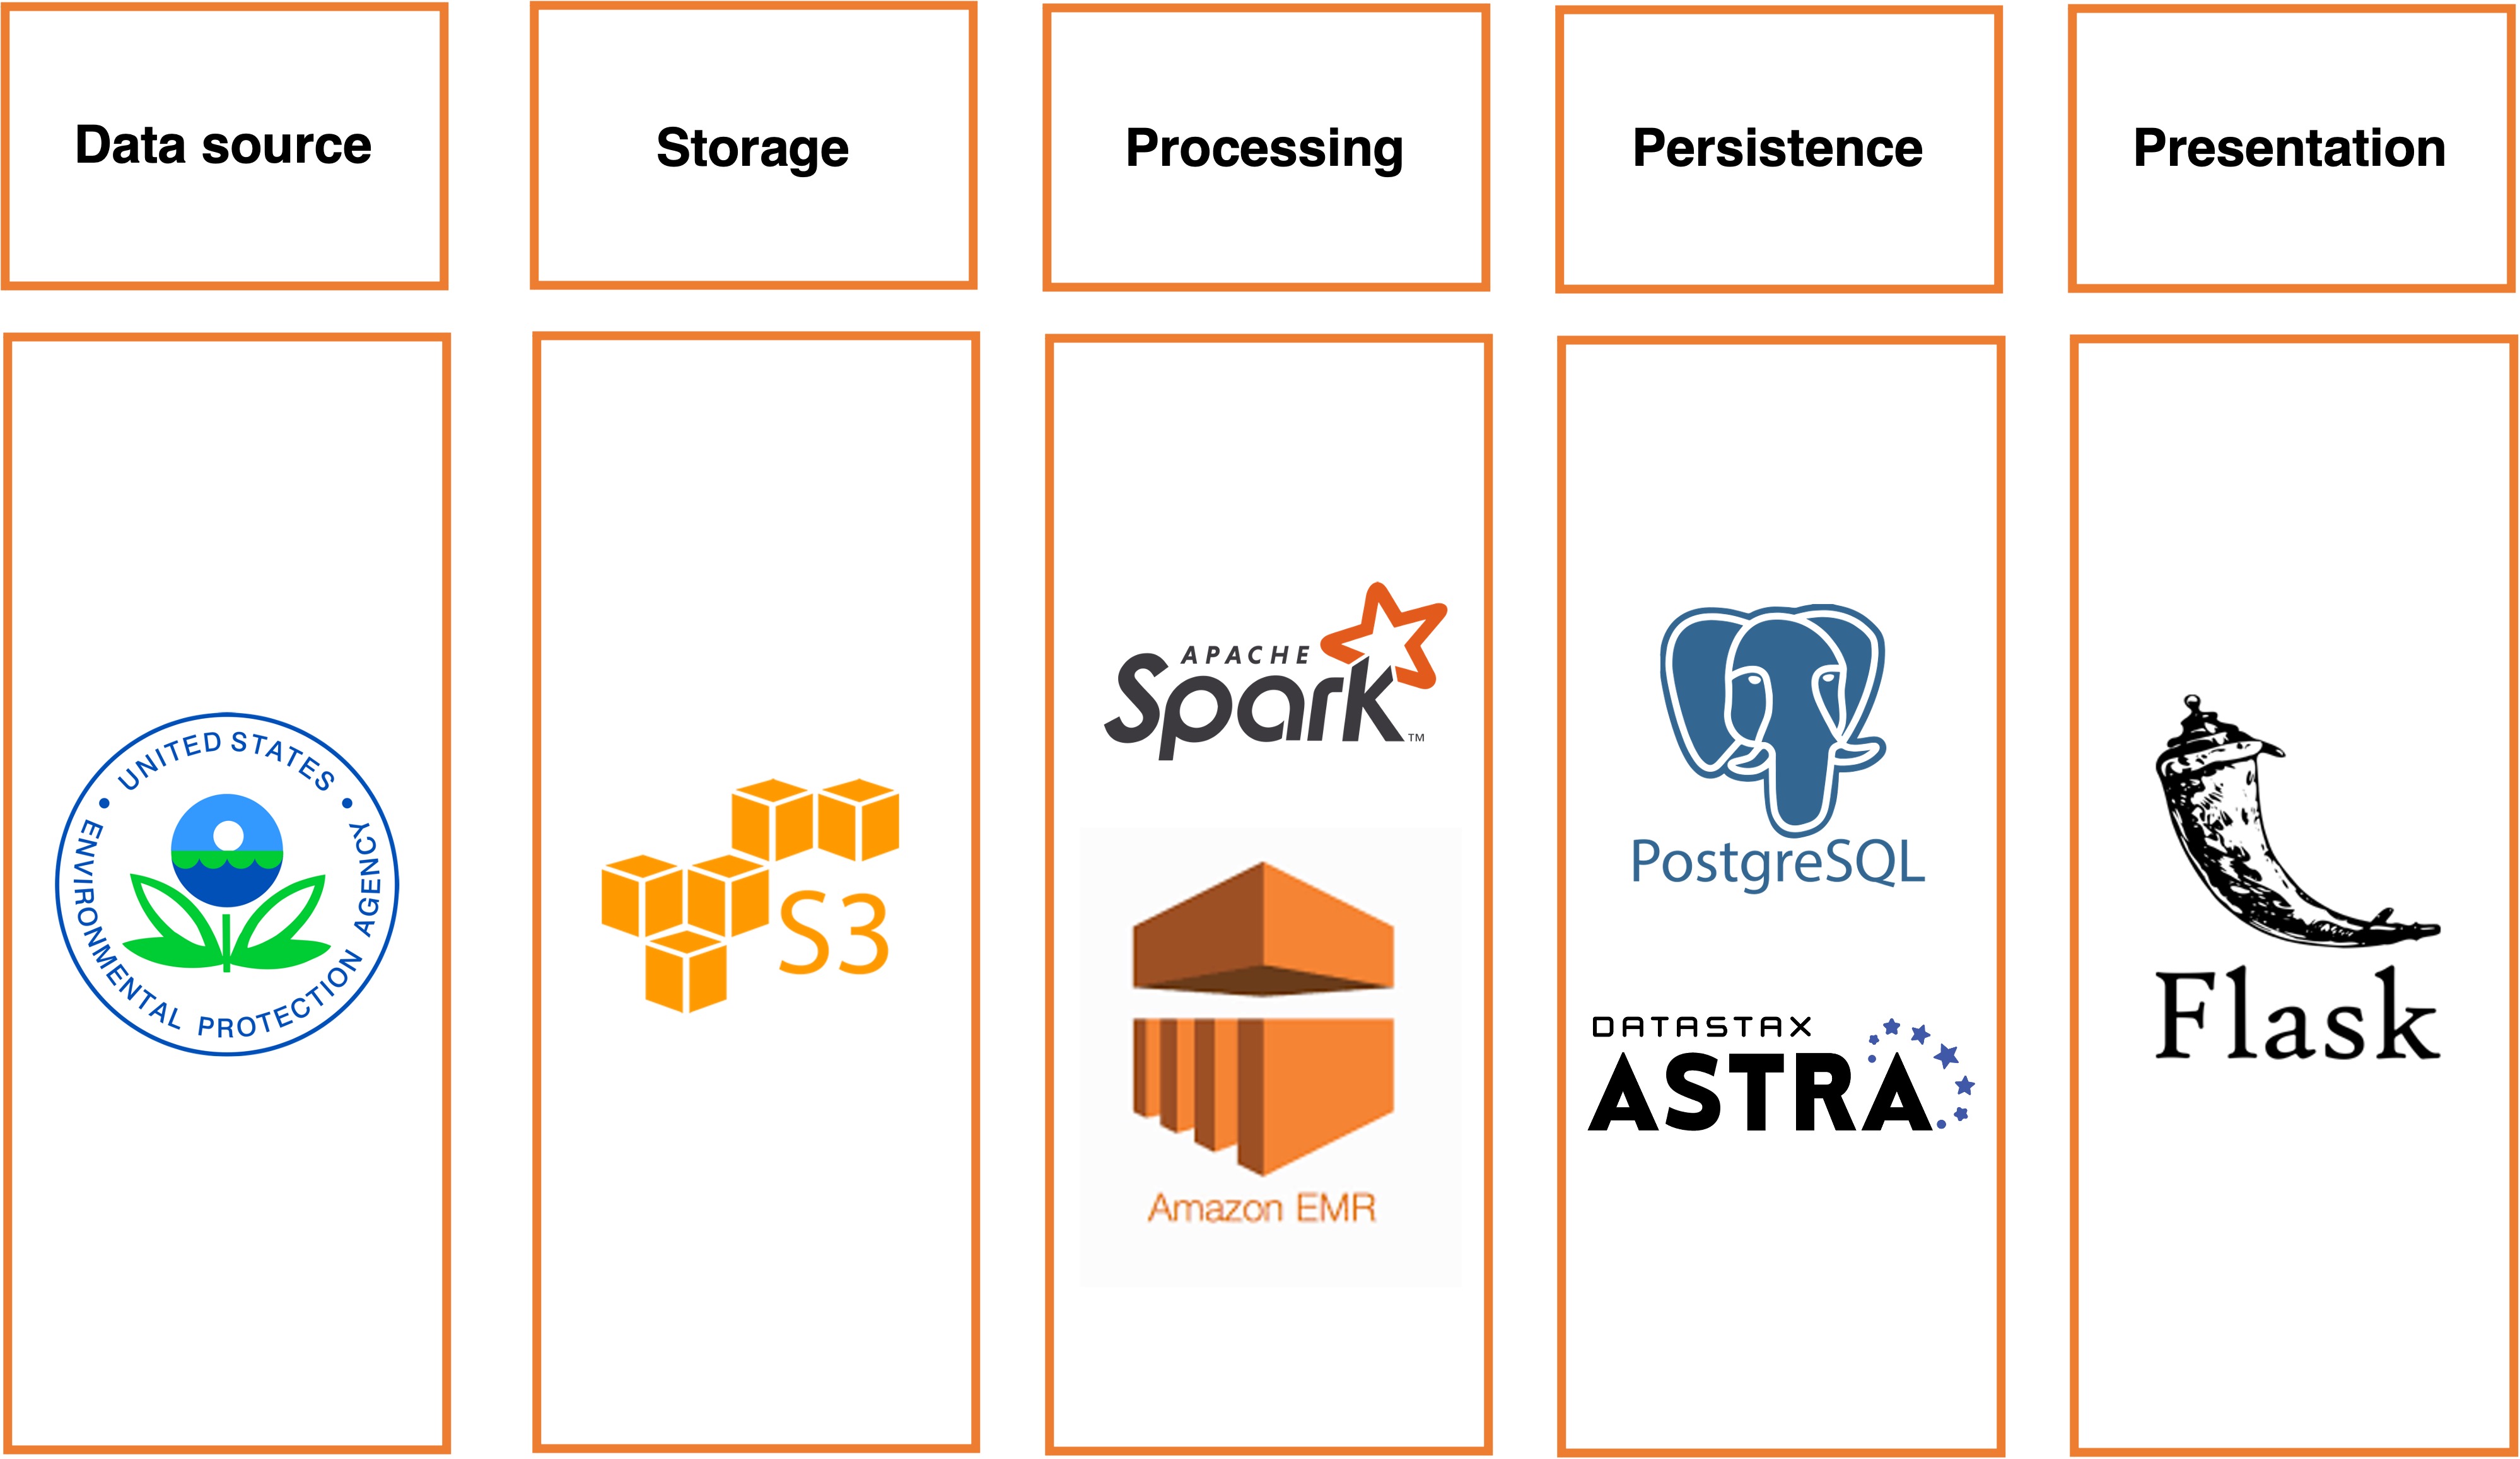
WeatherAware has the following data pipeline:
- Extract raw EPA sensor data (Amazon S3)
- Load EPA data in a Spark batch job; compute the weather map; calculate monthly averages (Spark, EMR)
- Store map and monthly measurements in a PostgreSQL database; store full historical data at hourly resolution in a Cassandra database
- In a Flask application, use Google Maps API to find latitude and longitude of a given U.S. address; locate a grid point closest to the address and retrieve data for this grid point
