A Duktape debug client for Visual Studio Code.
Developed for version 1.5.* of the Duktape runtime. See References below for more information.
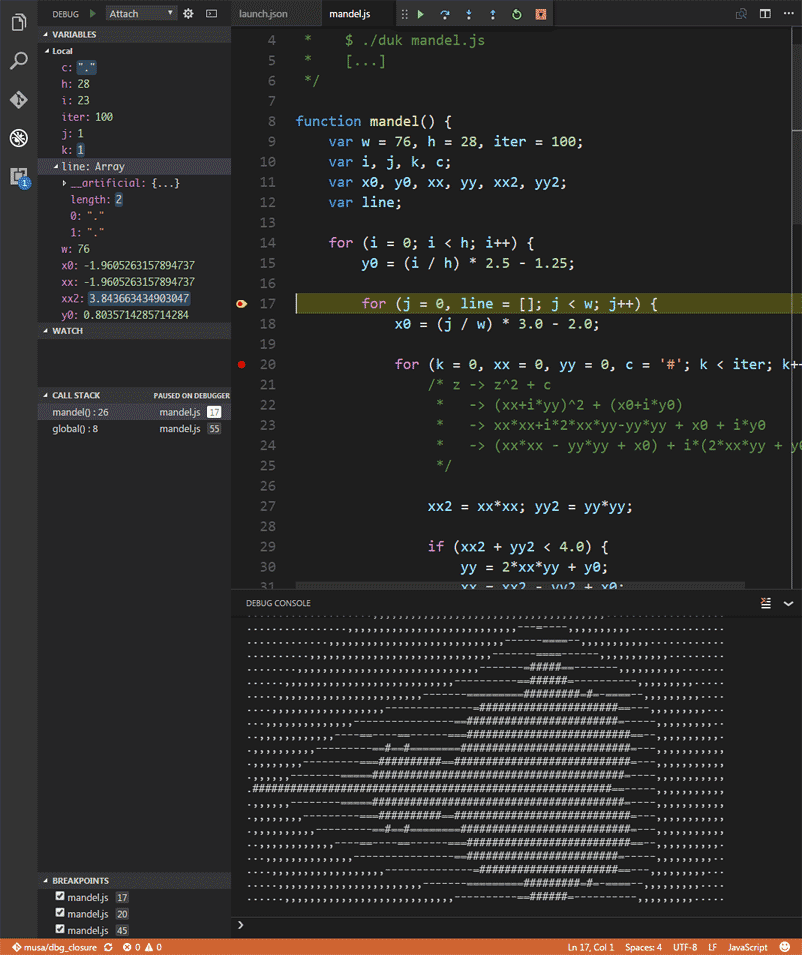
- Local scope inspection (Duktape only provides local scope).
- "this" object binding inspection.
- Deep object inspection (nested objects).
- Source map support. *inlined currently unsupported*
- Console input evals.
- Artificial property inspection.
It works. I'd like to refactor it and polish it more as I find the time.
Create a new launch.json configuration file and configure the address and port to your debug server's listening address and port.
"configurations": [
        {
            "name"        : "Duk Attach",
            "type"        : "duk",
            "request"     : "attach",
            "stopOnEntry" : false,

            "address"     : "localhost",
            "port"        : 9091,

            "localRoot"   : "${workspaceRoot}",

            "sourceMaps"  : true,
            "outDir"      : "${workspaceRoot}/bin"
}If you'd like to see the network traffic exchanged between the client and server, set the following option in your launch.json configuration:
"debugLog" : trueFor the debugger client to work with your Duktape host application, you must enable the following preprocessor macros:
// Required to enable debugger support:
#define DUK_USE_DEBUGGER_SUPPORT
#define DUK_USE_INTERRUPT_COUNTER

// To enable heap object inspection:
// Note: If this option is not enabled, you will only
//  be able to inspect local variables in the call stack.
//  No object properties will be inspectble.
#define DUK_USE_DEBUGGER_INSPECT

// (Optional) To forward log calls to the client:
#define DUK_USE_DEBUGGER_FWD_LOGGING
#define DUK_USE_DEBUGGER_FWD_PRINTALERT

// (Optional) To notify the client when an error is about to be thrown:
#define DUK_USE_DEBUGGER_THROW_NOTIFY

// (Optional) To pause on an uncaught errors:
#define DUK_USE_DEBUGGER_PAUSE_UNCAUGHT


// The following option to enable the 'DumpHeap' command is currently unsupported.
#define DUK_USE_DEBUGGER_DUMPHEAP
For more information about the aforementioned options, see this entry on the Duktape wiki.
You must also have a transport layer written in your Duktape host application to enable debugging via duk_debugger_attach() or duk_debugger_attach_custom(). You may use Duktape's reference implementation.
For an example of an application with debugger support, please see Duktape's command line app.
- https://code.visualstudio.com/docs/extensions/overview
- https://code.visualstudio.com/docs/extensions/example-debuggers
The adapter uses the debugger protocol based on Duktape version 1.5.0 of debugger.rst.
Special thanks to Sami Vaarala for developing Duktape, and for freely sharing it with the community. A "thank you" also to the VSCode team for facilitating their open-source IDE and the ability to easily make extensions for it.
This code contains portions borrowed or adapted from the vscode nodeJS debugger and Sami Vaarala's web-based nodeJS reference implementation of a Dukatape debug client.
(c) Harold Brenes 2016-2017
Ἐμοὶ γὰρ, τὸ ζῆν Χριστὸς, καὶ τὸ ἀποθανεῖν, κέρδος.