This project try to answer to the second mini challenge of the VAST challenge 2015 (http://vacommunity.org/VAST+Challenge+2015).
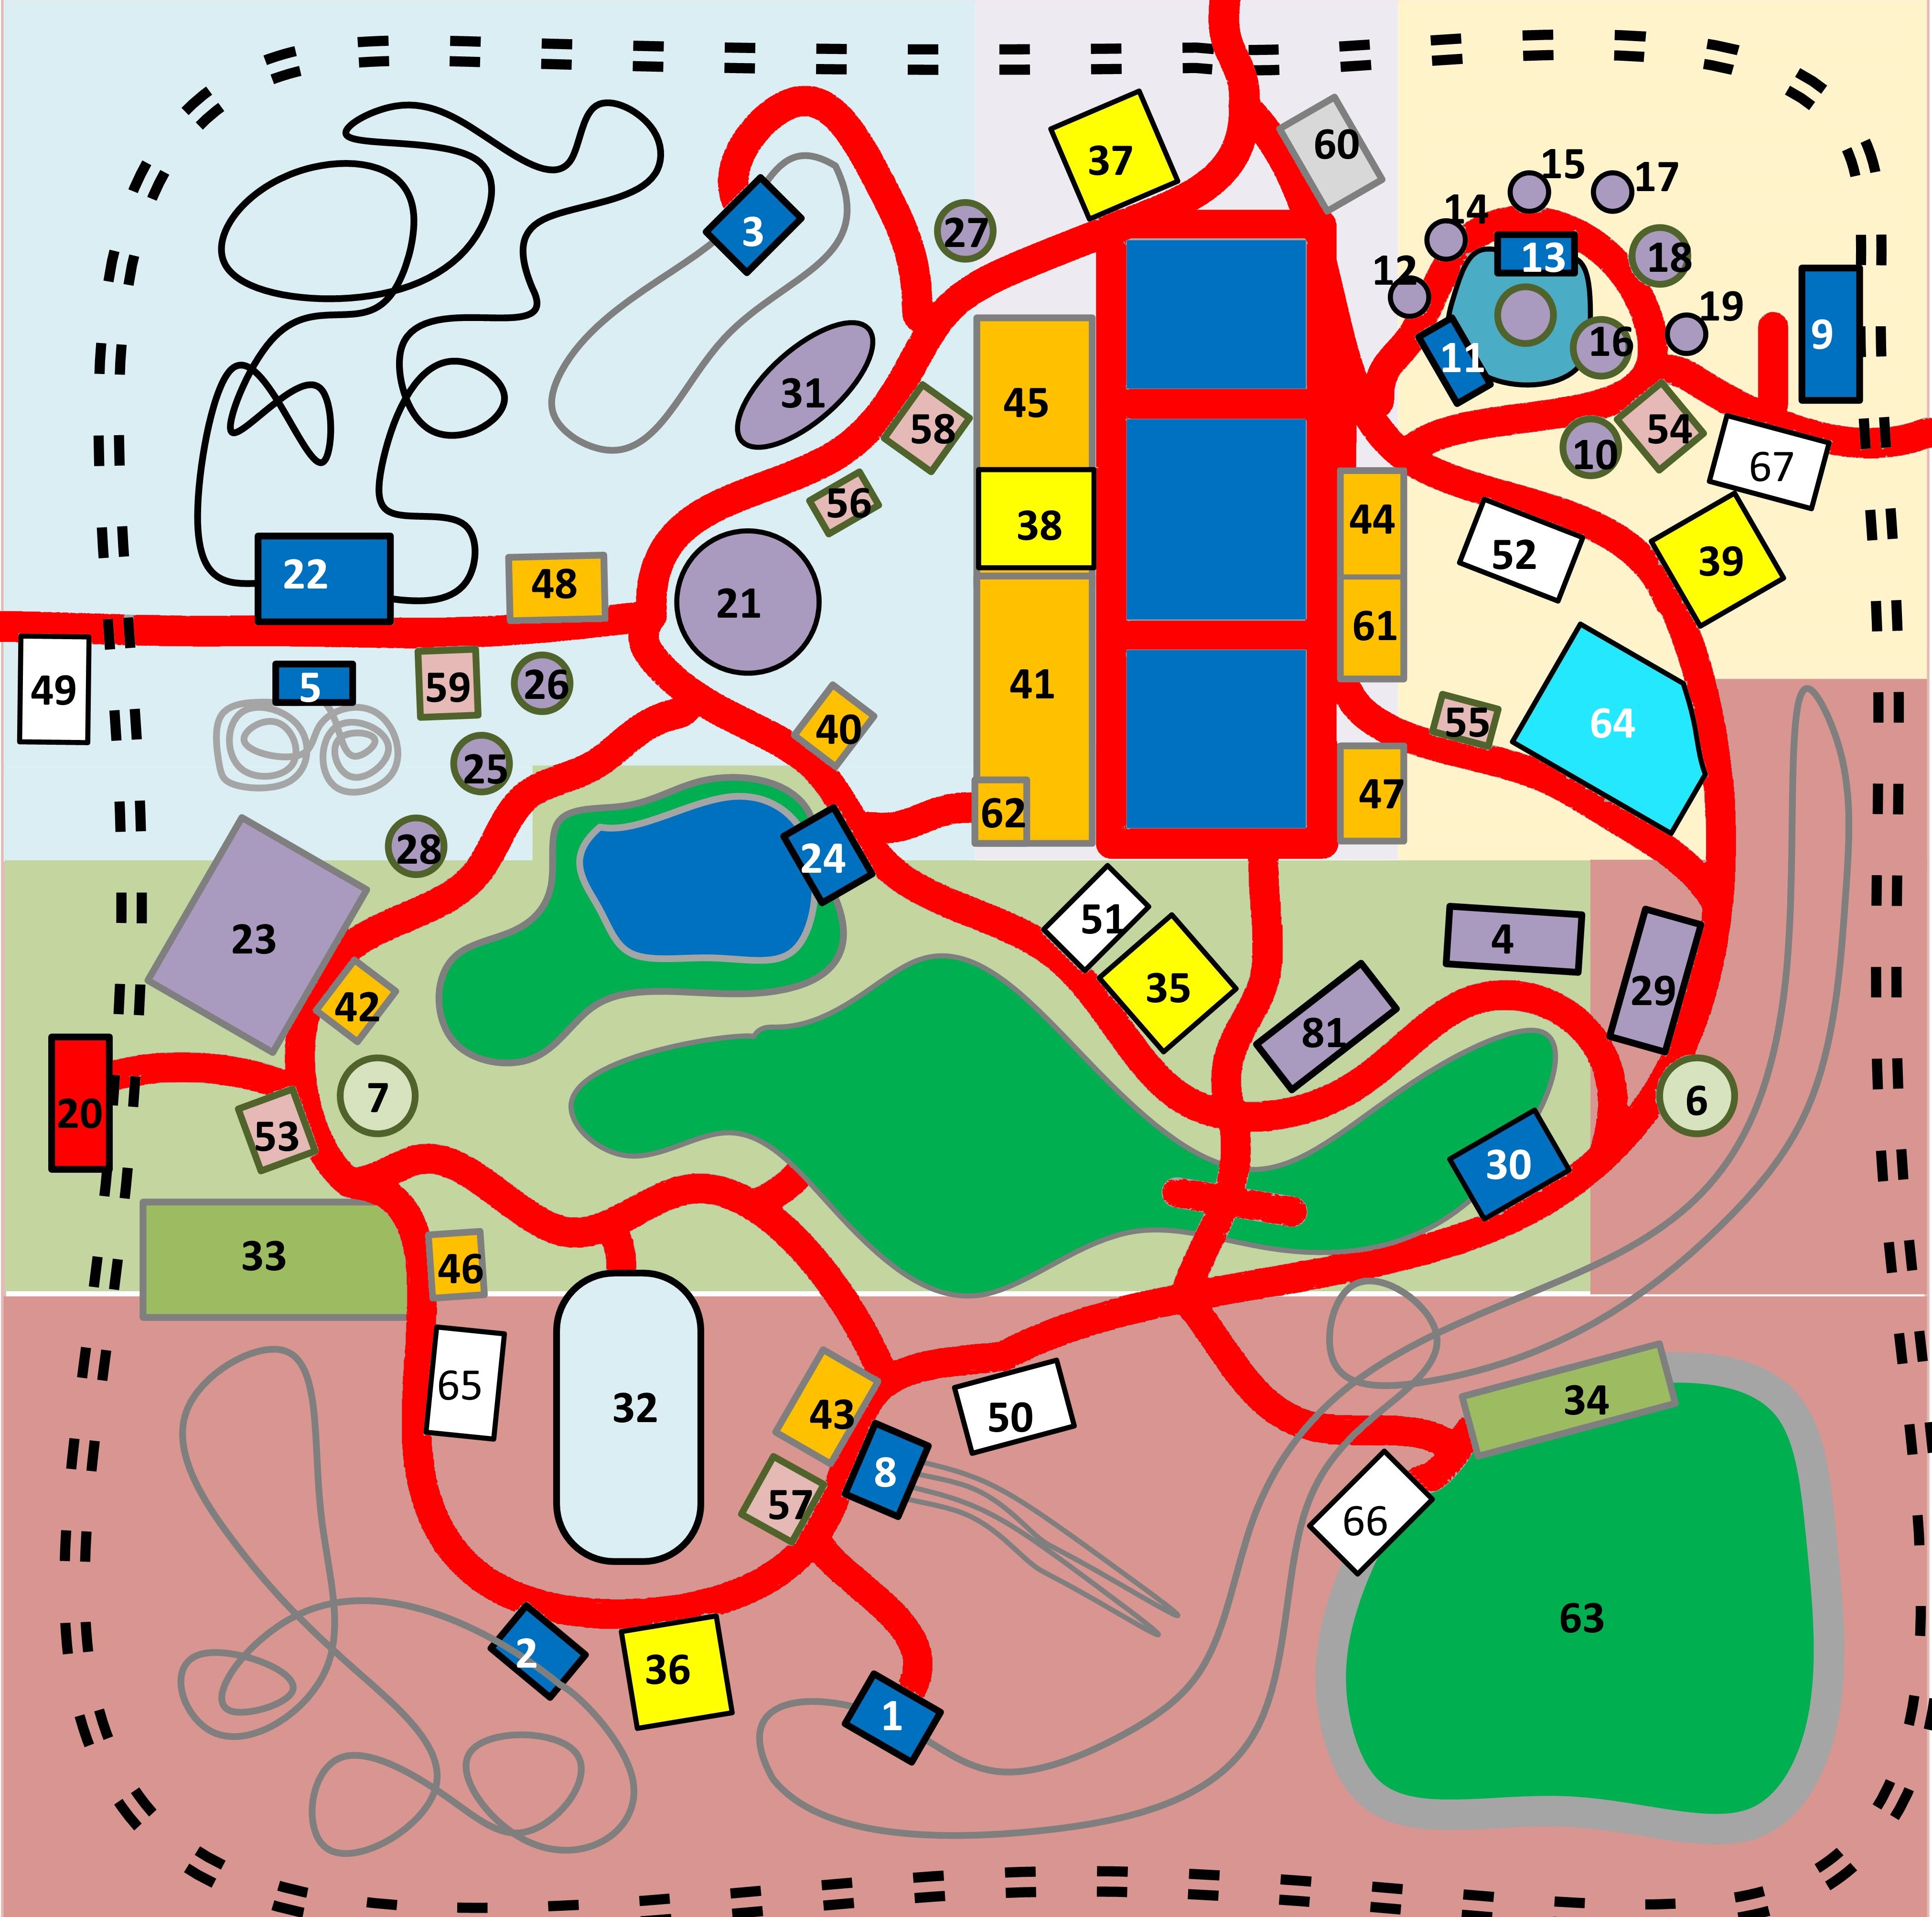
This year’s challenge scenario is set in an amusement park similar to Hershey Park, King’s Dominion, or Busch Gardens Williamsburg. The simulated park covers a large geographic space (approx. 500x500 m^2) and is populated with ride attractions, restaurants and food stops, souvenir and game stores, an arcade, a show hall, and a performance stage. The attractions are categorized into Thrill Rides, Kiddie Rides, Rides for Everyone, Food, Restrooms, Shopping, and Shows & Entertainment.
Patterns can be found in the movement through the park and communications among visitors, including expected normal visit patterns and unexpected patterns. The VAST Challenge for this year is focused on exploration of these various patterns
 |
|---|
| The map of the DinoFun World, the place where the facts took place |
Another data file contains communication information. The records appear as follows:
- 2014-6-06 08:04:01,5157734,5157729,Entry Corridor
- 2014-6-06 08:14:31,715543,715544,Wet Land
- 2014-6-08 10:56:30,1964024,external,Kiddie Land
The fields for this file are: timestamp, from (the sender ID), to (the recipient ID), and location (area where communications occurred).
Location can be: Entry Corridor, Kiddie Land, Tundra Land, Wet Land, or Coaster Alley (see the Park Map on the website).
So, above, person 5157734 communicated to 5157729 from the Entry Corridor at 08:04:01 AM. Person 715543 texted person 715544 from the Wet Land at 08:14:31. Person 1964024 sent an external text to someone outside of the park at 10:56:30. External text recipients are not designated in any other way
Mini-Challenge 2 asks you to dive into the communications over time that took place among the park visitors using the park app. Linkages between visitors and among park patrons and park staff could reveal behaviors of interest.
Identify those IDs that stand out for their large volumes of communication. For each of these IDs:
- Characterize the communication patterns you see.
- Based on these patterns, what do you hypothesize about these IDs?
 |
|---|
| Barchart of the top-senders and top-receivers ID |
 |
|---|
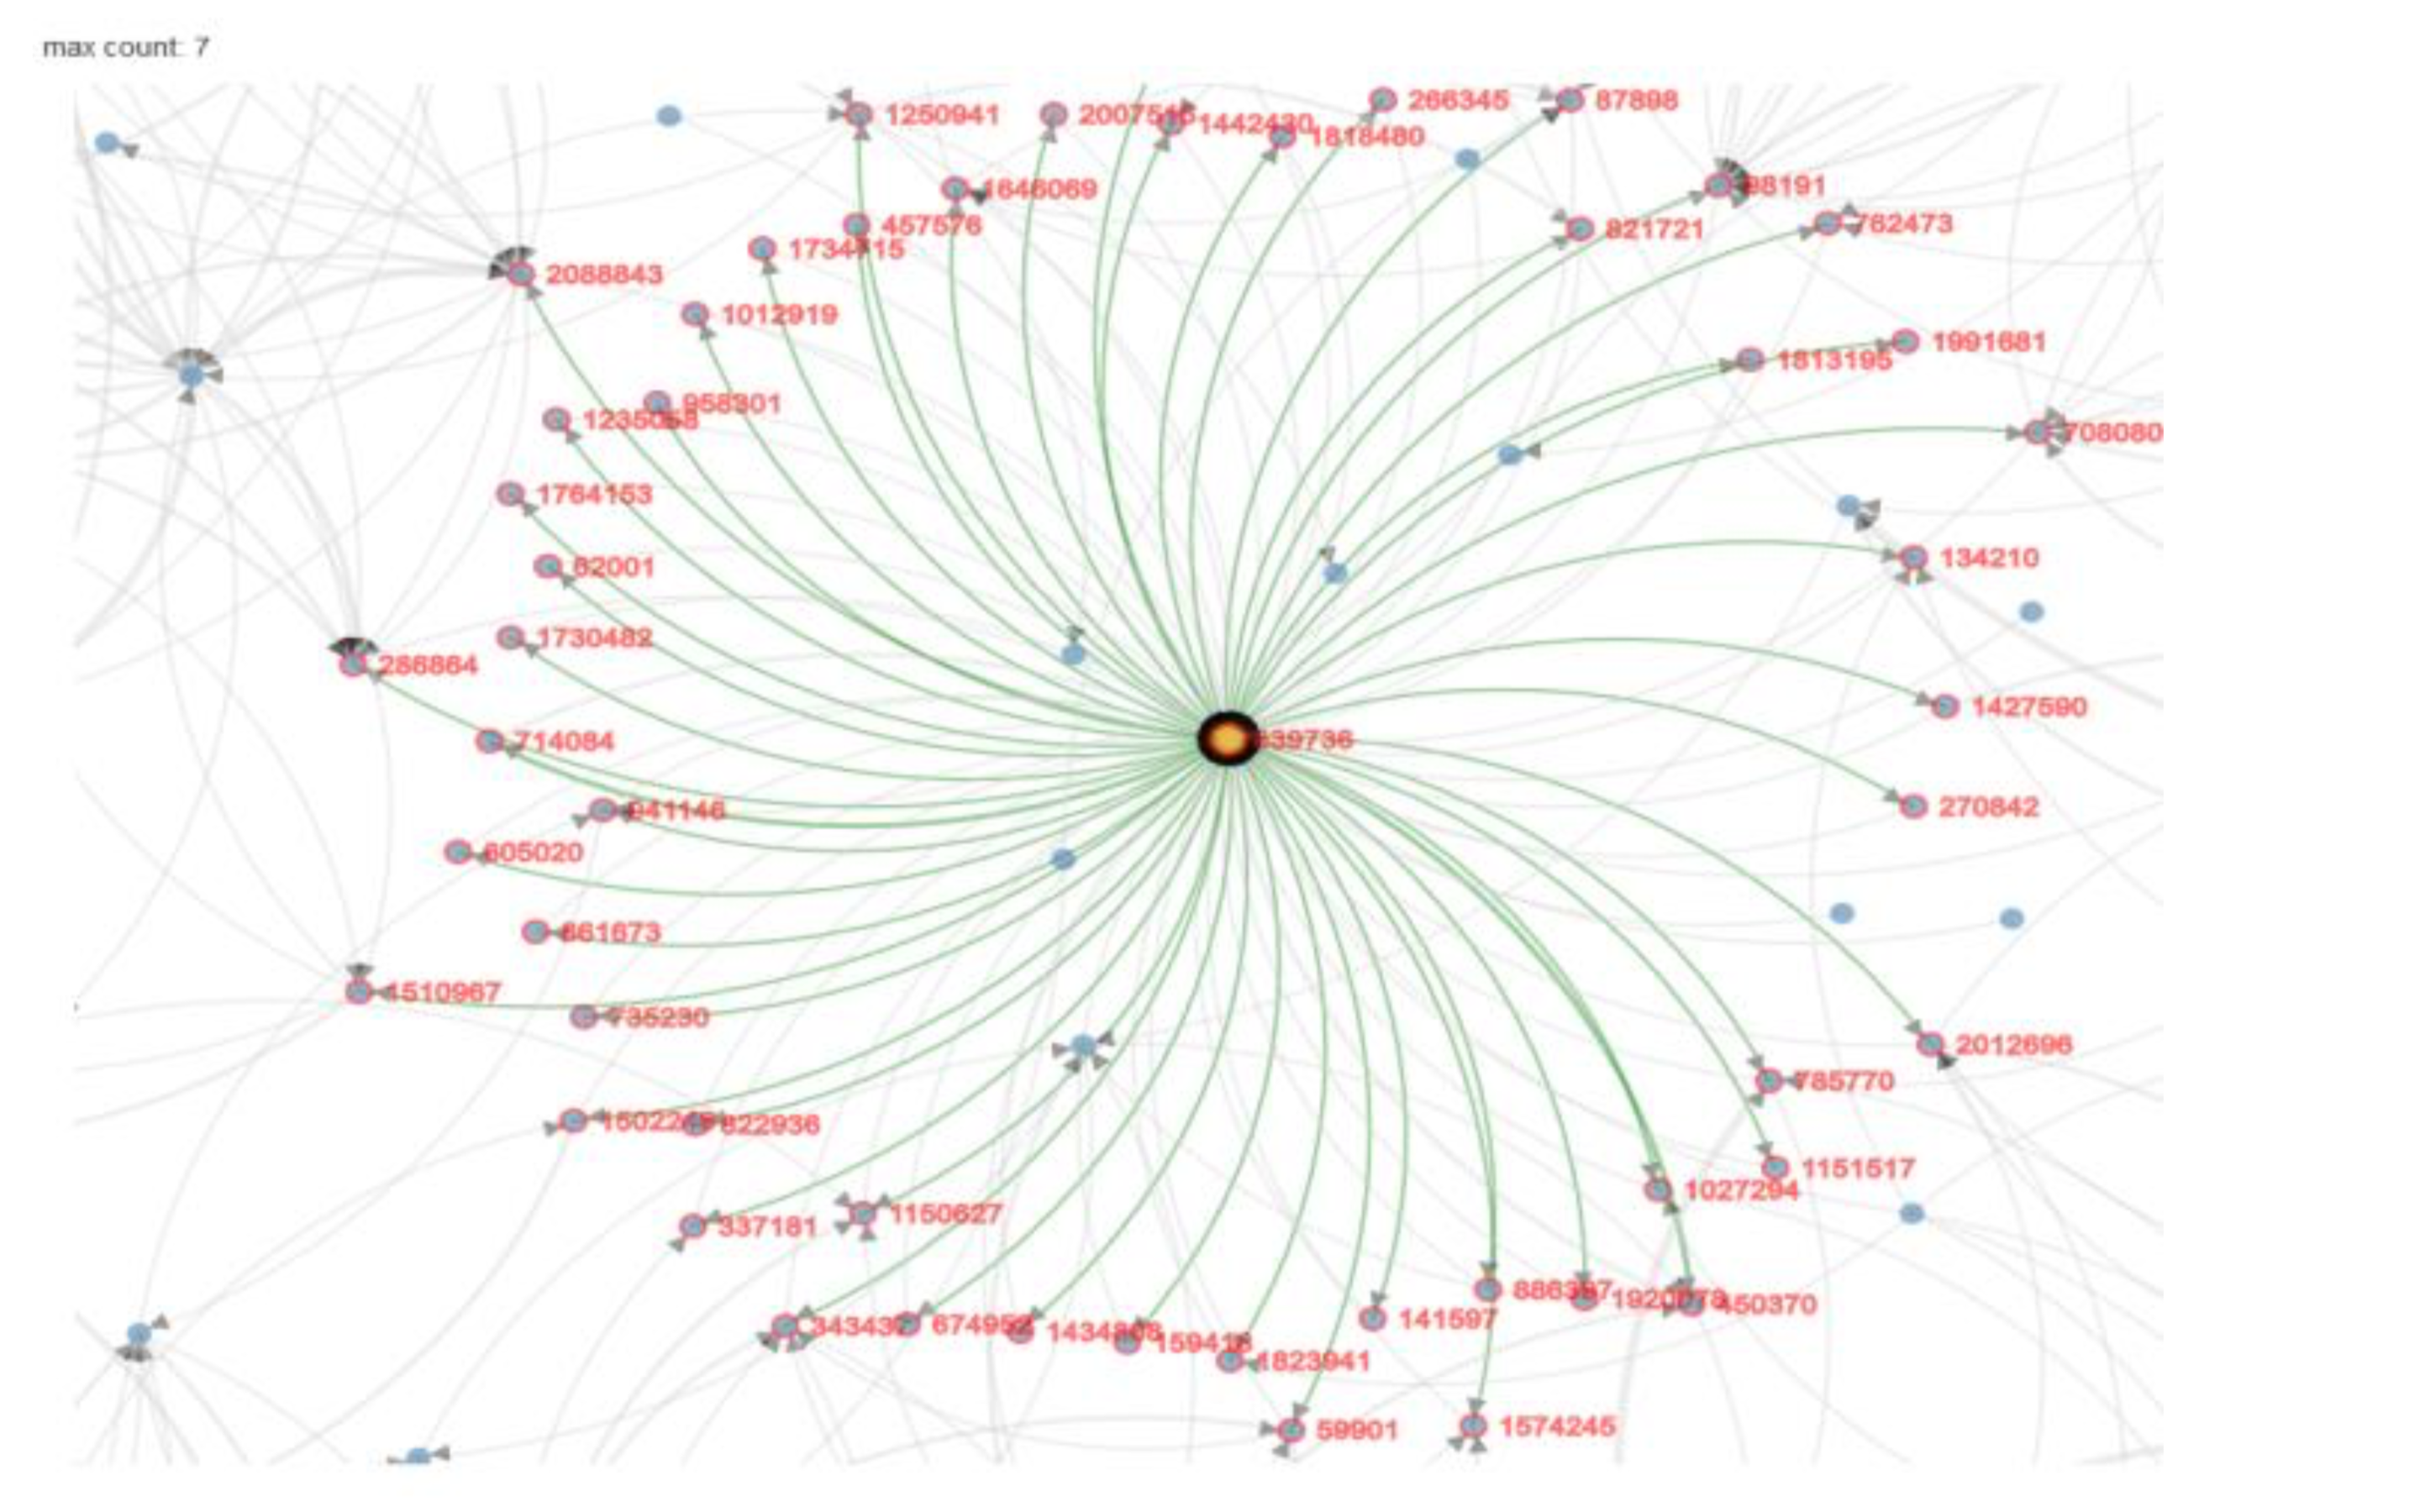
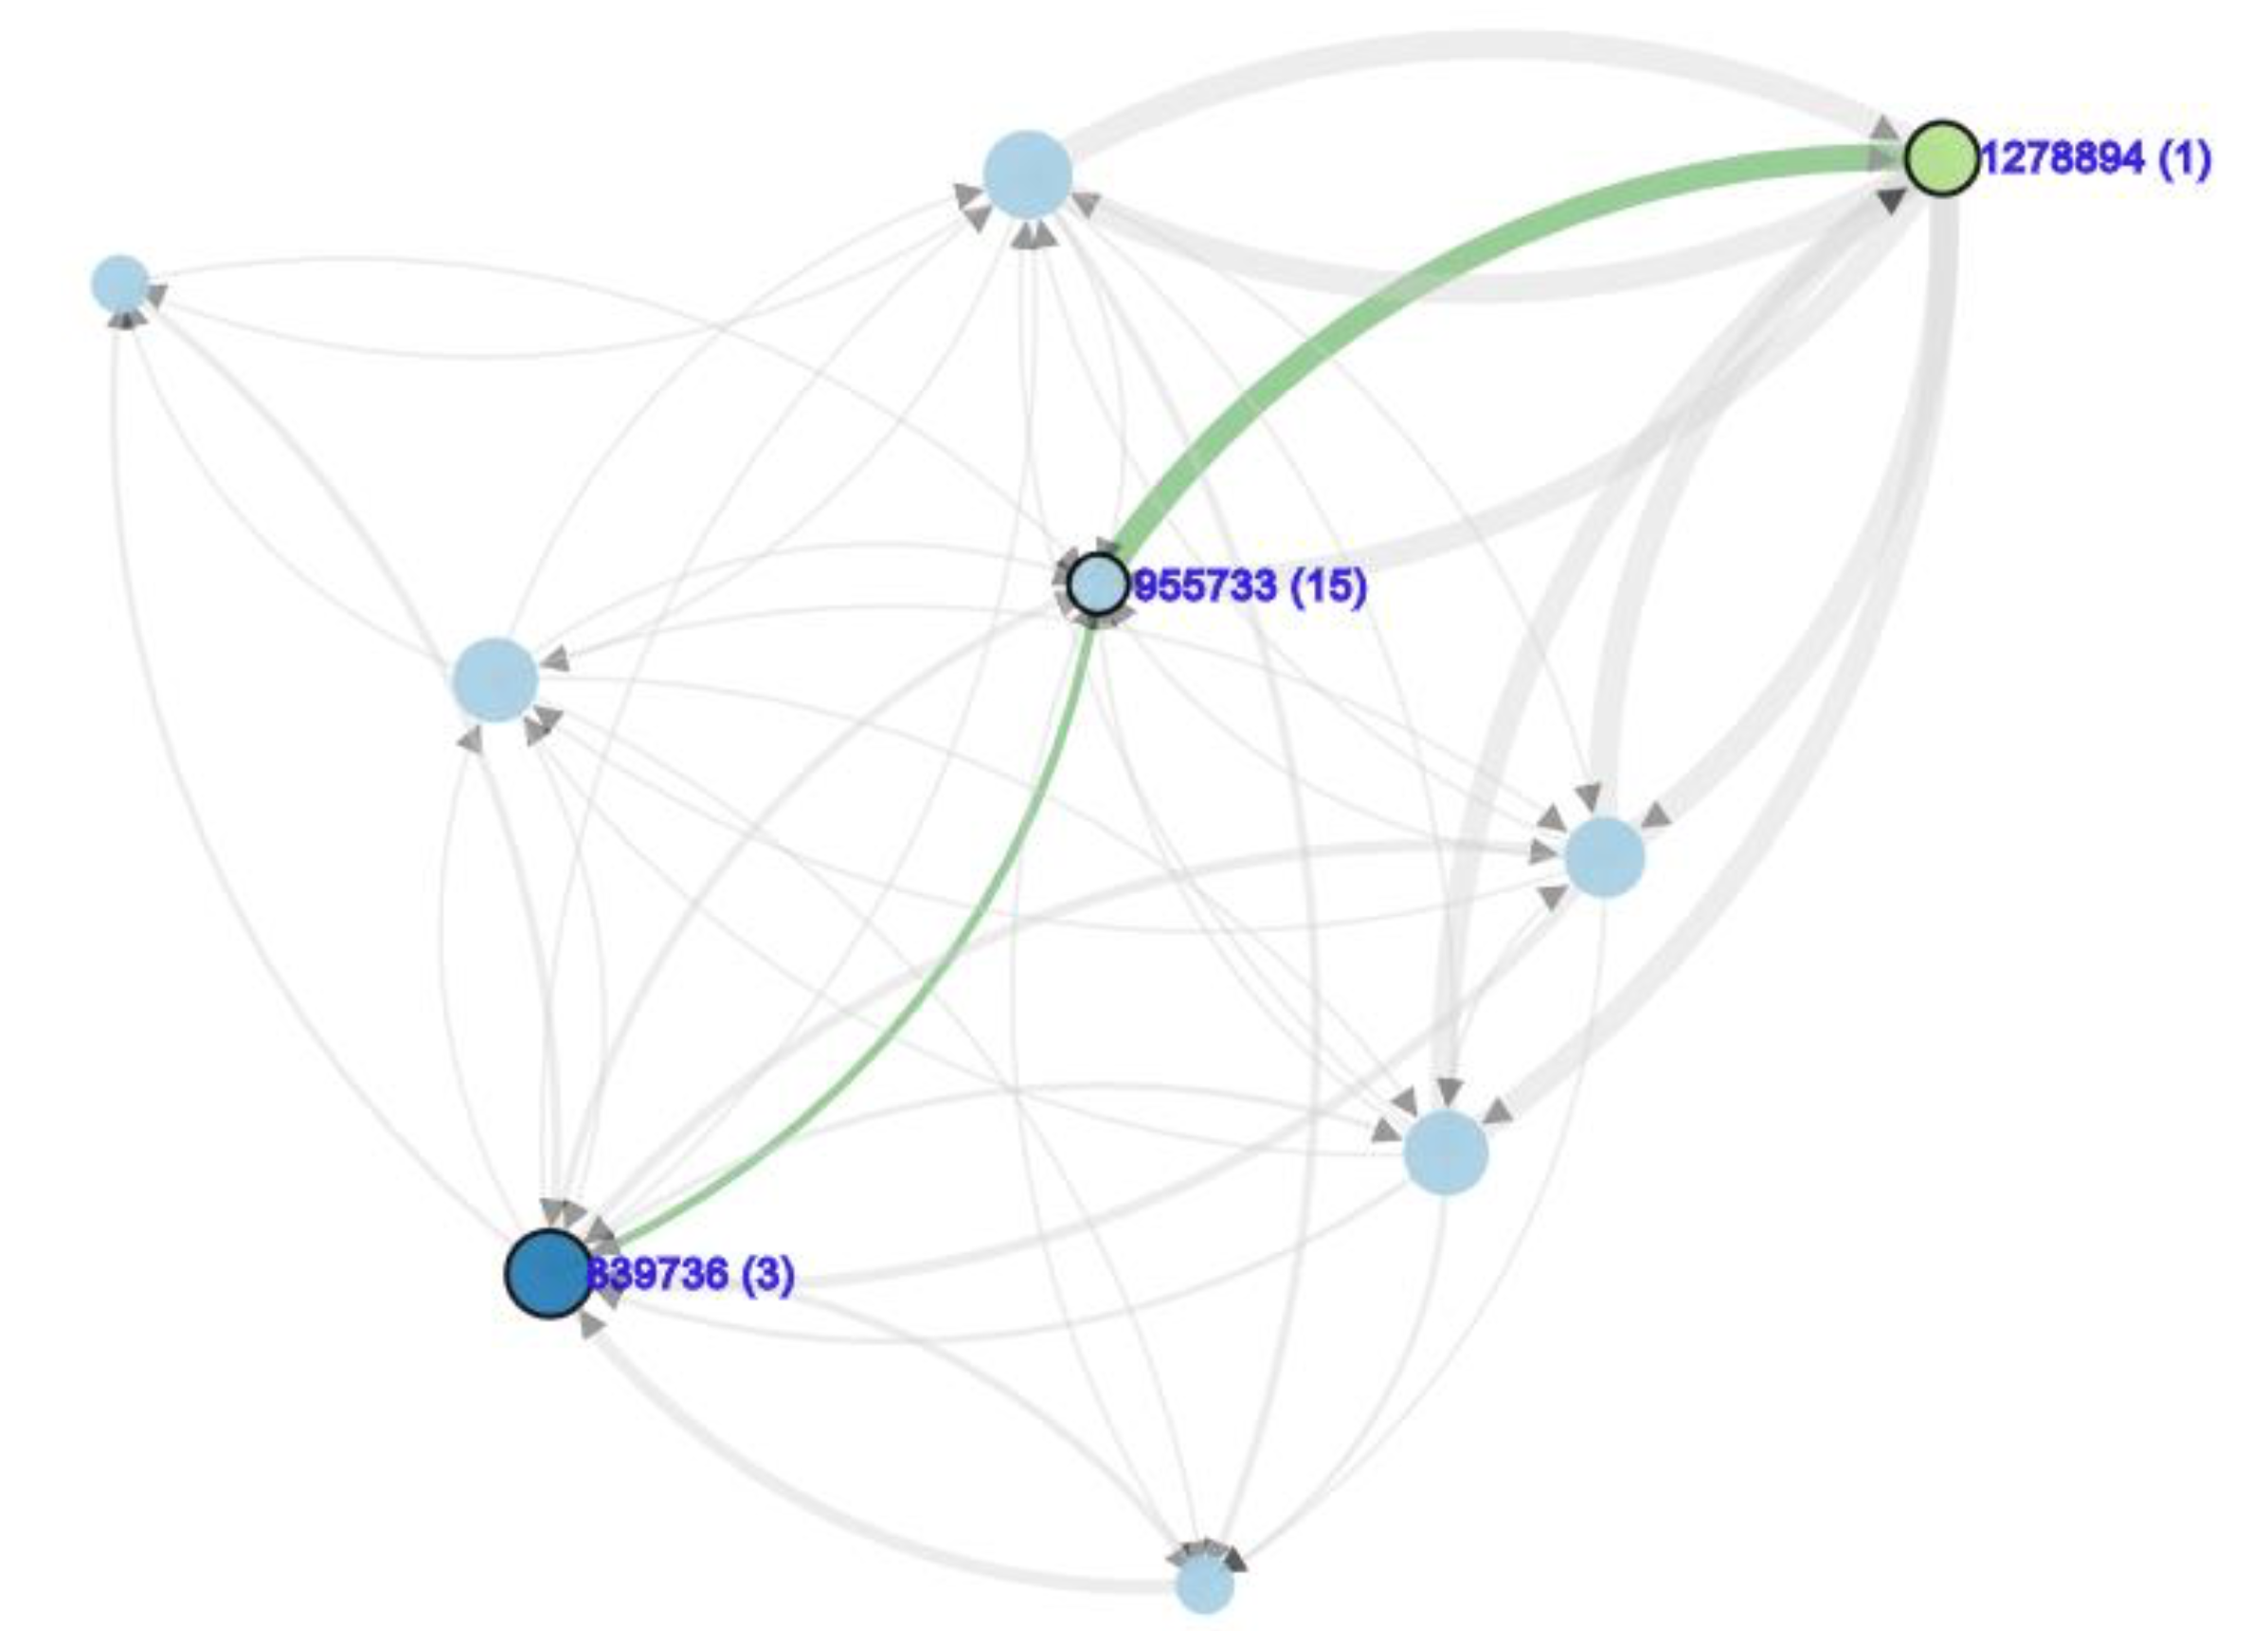
| Ego network of one of the two IDs that outstanding for traffic |
Eventually, we discover that ID 1278894 and ID 839736 are IDs that represent park's customer services. A lot of persons concact them but just for few messages at time.
Describe up to 10 communications patterns in the data. Characterize who is communicating, with whom, when and where. If you have more than 10 patterns to report, please prioritize those patterns that are most likely to relate to the crime.
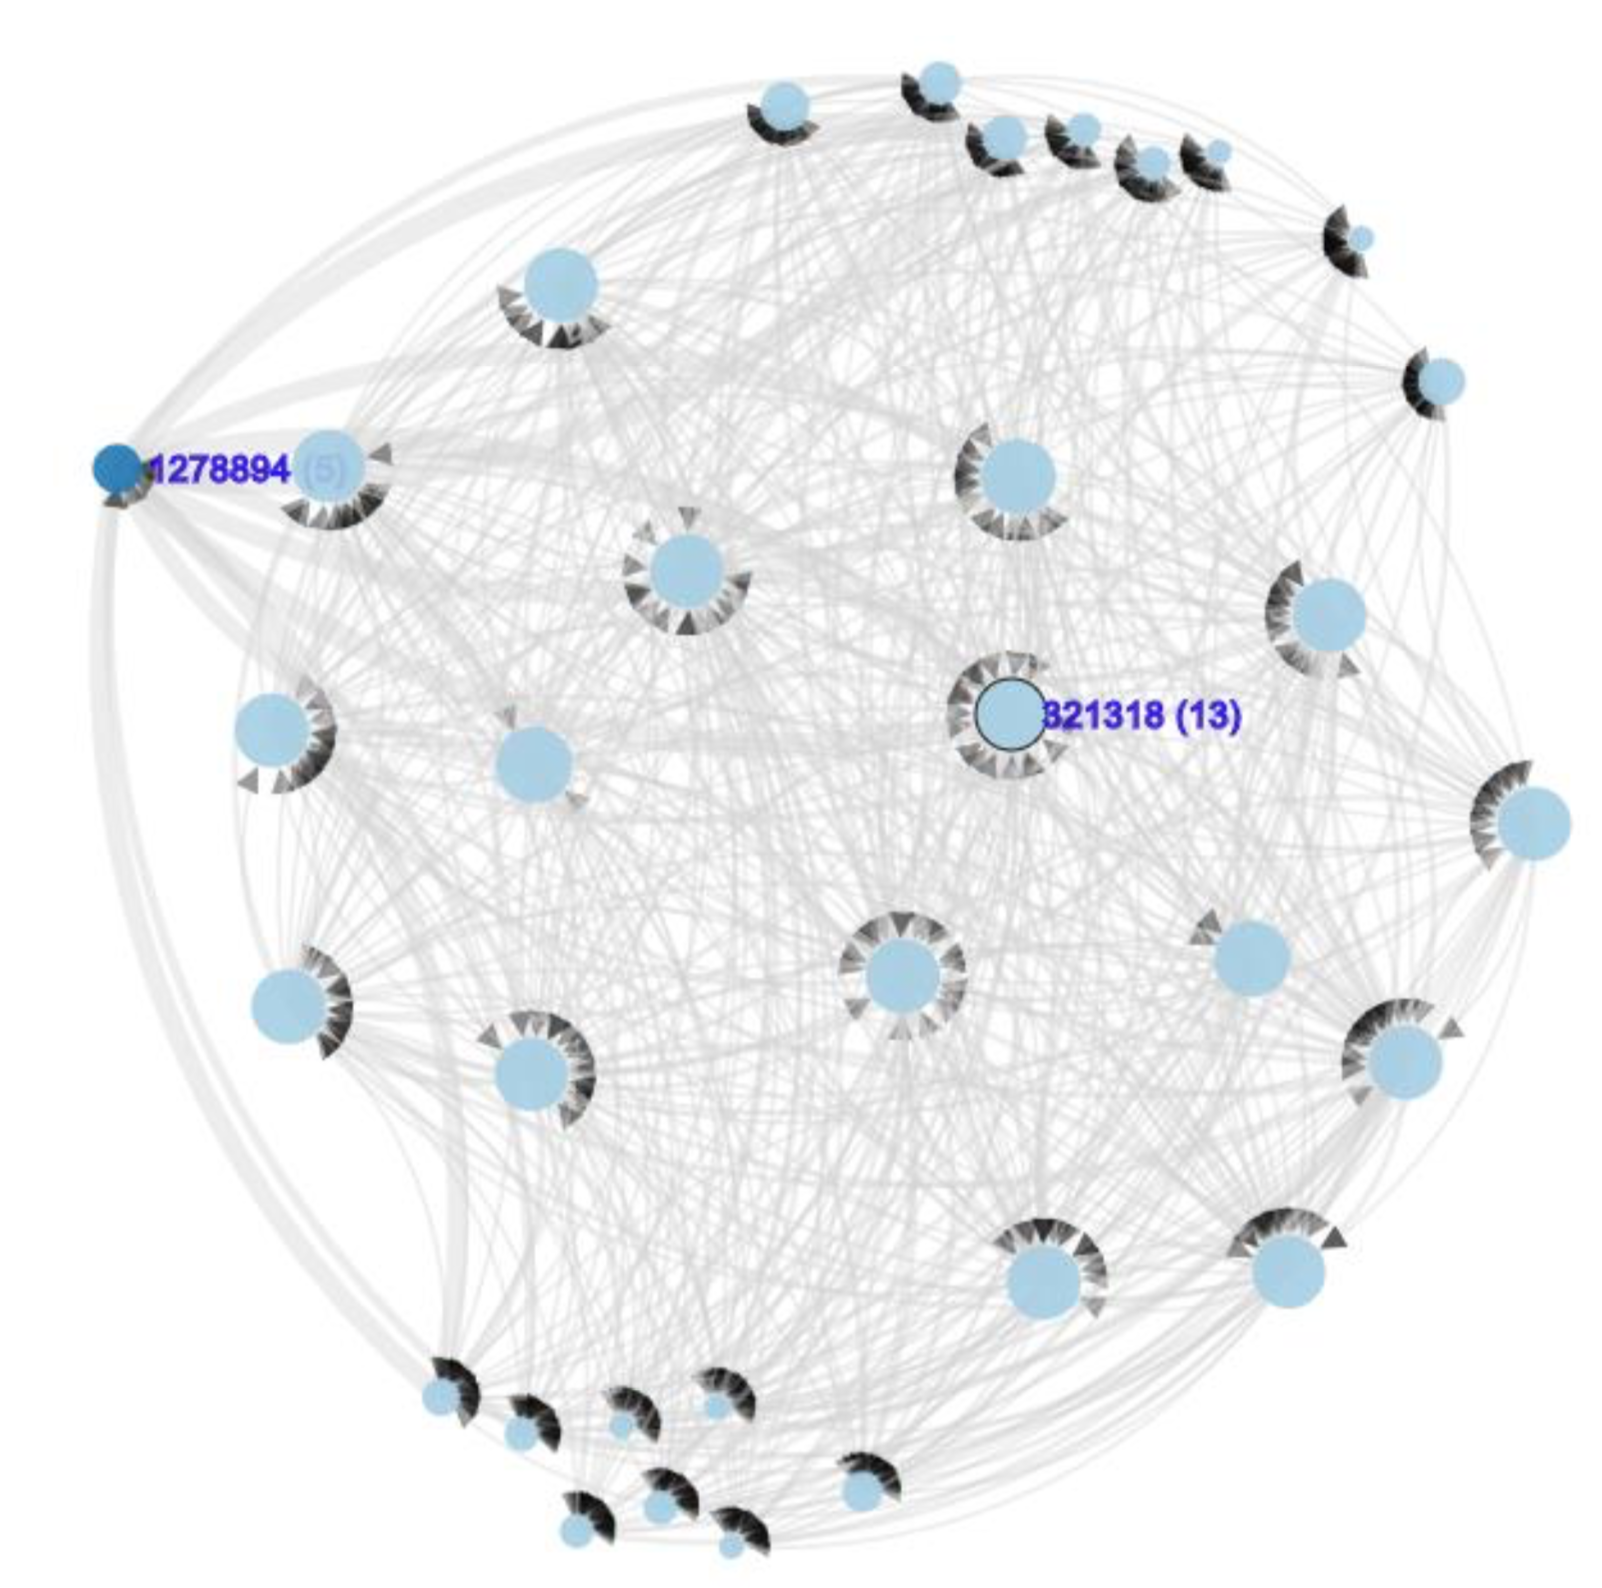
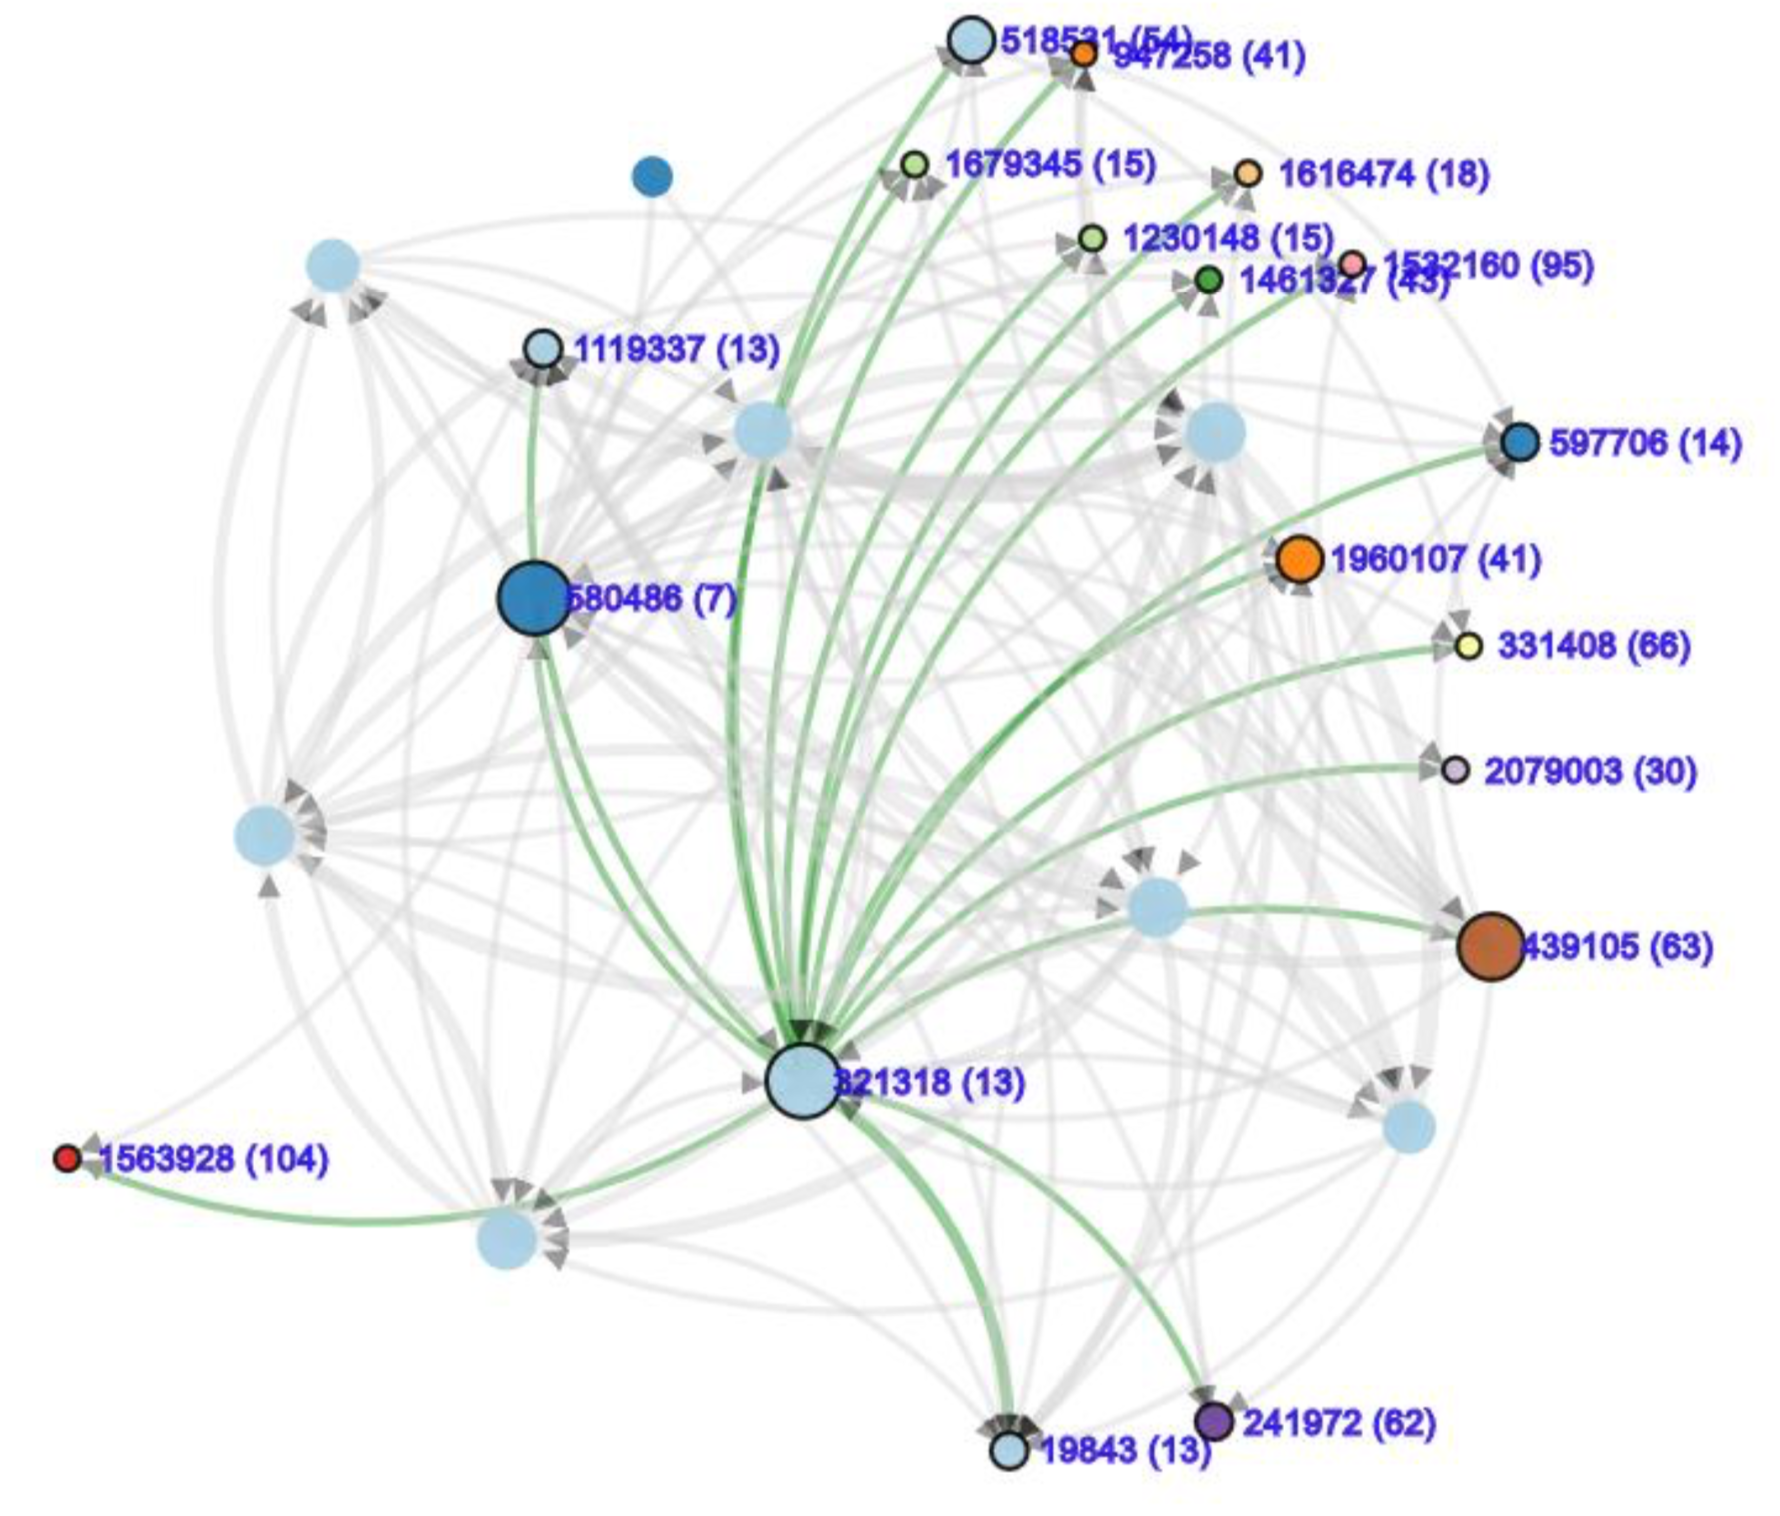
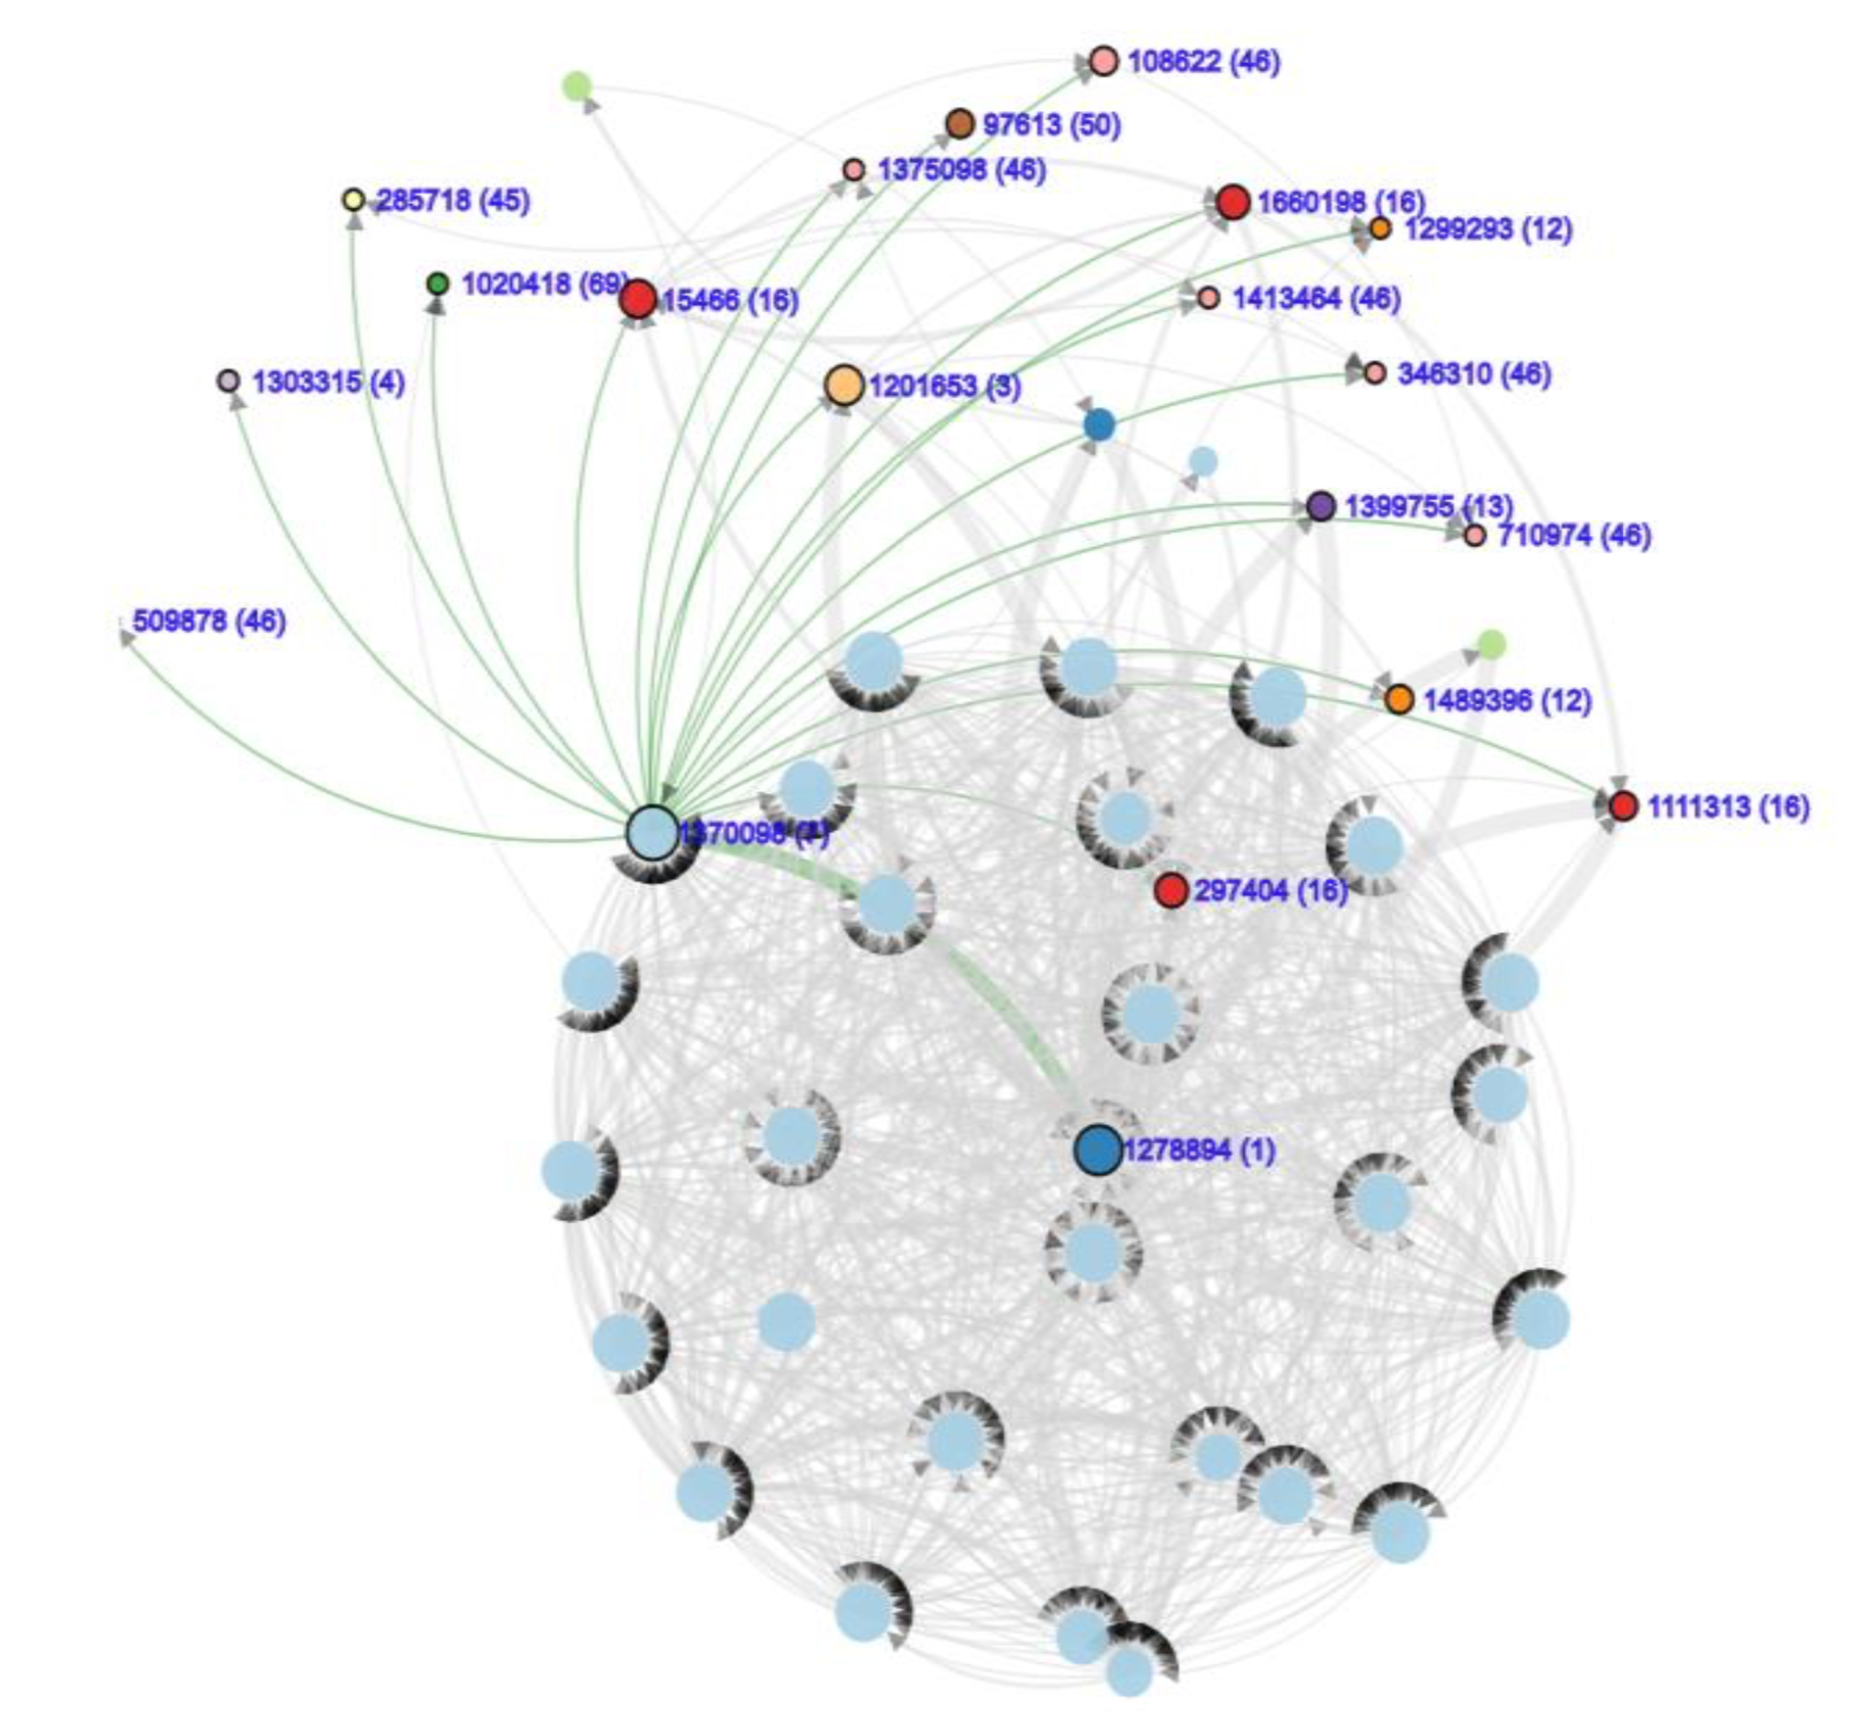
We first need to discover communities in our dataset. This has been done with the comunity discovey algorithm Demon.
Different communites are represented using different color node. However, since the number of communities are grather then the available colour, having the same color does not mean belonging to the same group. A workaround was to specify the comunity number between brackets, next to the node ID.
 |
 |
|---|---|
 |
 |
From this data, can you hypothesize when the vandalism was discovered? Describe your rationale.
On Sunday at 11 am, we notice more messages sent to external than usual.
For the full explanation, we invite you to read the project report document (italian version only, sorry)
