A simple Node.js/io.js debugger for daily use.
Open a javascript (.js) file and execute the start-resume command (F5) to launch the debugger.
Debug panels will show up as shown in the image below.
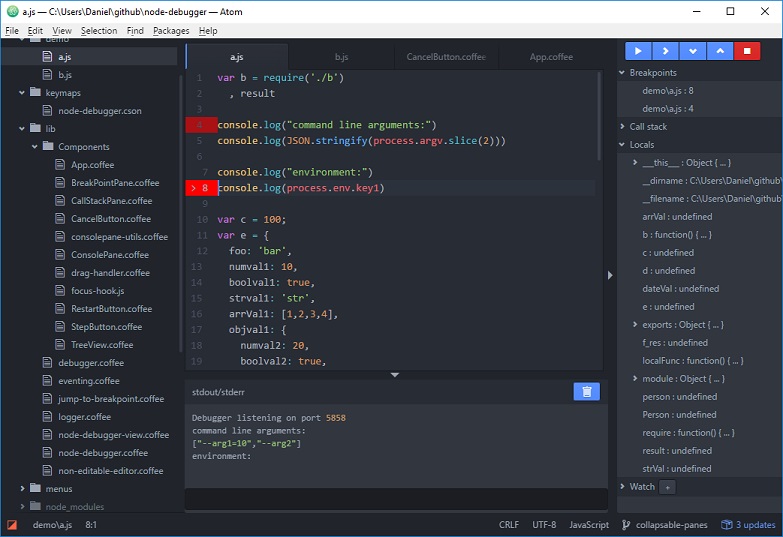
The '>' symbol in the gutter marks the current line of execution.
Execute the toggle-breakpoint (F9) command to set a breakpoint. The breakpoint will be displayed in the gutter using a red marker.
Execute start-resume (F5) again to resume debugging or use the step-next (F10), step-in (F11) or step-out (shift-F11) commands.
You may access the commands using CMD/Ctrl+p or by using the shortcut key specified within the brackets.
'node-debugger:start-resume' (F5)
'node-debugger:start-active-file' (ctrl-F5)
'node-debugger:stop' (shift-F5)
'node-debugger:toggle-breakpoint' (F9)
'node-debugger:step-next' (F10)
'node-debugger:step-in' (F11)
'node-debugger:step-out' (shift-F11)
'node-debugger:attach'
'node-debugger:toggle-debugger' (F12)The following attributes can be set to control the node-debugger.
- nodePath - path to node.js executable, default: platform dependent
- nodeArgs - arguments sent to node.js during launch, default: ''
- appArgs - arguments sent to the application during launch, default: ''
- debugHost - the machine name or ip-address of the host (only used when attaching to external node processes), default: '127.0.0.1'
- debugPort - the port used to communicate to the launched process, default: 5858
- env - the process environment variables (if left empty the environment will be inherited), default: ''
- scriptMain - the preferred startup file, default: ''
An example of a configuration is given below.
"node-debugger":
  nodePath: "C:/program/nodejs/node.exe"
  nodeArgs: "--use-strict --use_inlining"
  appArgs: "--arg1=10 --arg2"
  debugHost: "192.168.0.20"
  debugPort: 5860
  env: "key1=value1;key2=value2;key3=value3"
scriptMain: "c:/myproject/main.js"When executing the start-resume command the node-debugger will try to figure out which file that is the main file of the current atom project. This is the strategy being used:
- use configured entry point (scriptMain)
- attempt to read entry point from package.json in the project root folder
- attempt to start currently open file (ctrl+F5 hot-key)
- cannot start debugger
Start your node application in debug mode using
>node --debug=5858 a.jsor
>node --debug-brk=5858 a.jsMake sure that your node-debugger settings for debugHost and debugPort are matching what you are using. In the case above debugPort should be 5858.
Execute command node-debugger: attach either from the menu or using the command panel.
Check in the node-debugger package settings that the node path is set correctly.
Please click here to provide me more suggestions to improve this debugger, thanks :D
CoffeeScript support
Error HandlingIn Node.js>=0.12 and io.js. The process doesn't stop when your process finished.
So it will have no response from debugger server and will not keep going debugging.
When you face that issue, just use the x button to stop the process by yourself.
Issue report is here: nodejs/node#1788