https://esunwookim619.github.io/bestClashPlayers/
Clash Royale is a popular mobile game made by Supercell. As one of the top games from the Google Play Store, it is enjoyed by many and is even played competitively: featuring global rankings and pro tournaments. Due to its competitive nature, statistics of gameplay is important to many players. Best Clash Royale Players features the best players around the world along with some of their game stats.
- D3.js for interactive visualization
- Javascript 9
- Webpack 4.32.2 to bundle and serve up various scripts
- Clash Royale API
Users will be able to:
-
View the locations of the top ranked players
The globe was done using d3.geoOrthographic() along with its path features.
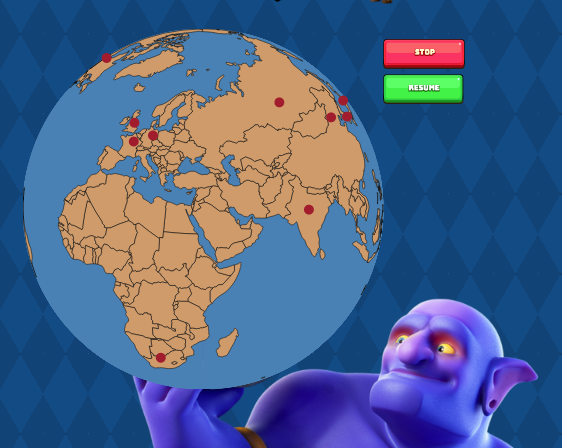
The Stop and Resume buttons were implemented by keeping tracking of the time when utilizing .stop() and .restart().
function stop() {
 totalElapsedTime = d3.now() - startTime;
 t.stop();
}

function restart() {
 startTime = d3.now() - totalElapsedTime;
 t.restart(function(elapsed) {
   let elapsedTime = d3.now() - startTime;
   projection.rotate([
     config.speed * elapsedTime - 120,
     config.verticalTilt,
     config.horizontalTilt
   ]);
   svg.selectAll("path").attr("d", path);
   drawMarkers();
 });
}
-
Toggle between different sets of data
Toggling effect was done by implementing an update method that redrew the pie chart with a new set of data.
-
See each player's best trophy record.

Data had to be static due to restrictions on fetching data through the Clash Royale API. Will implement feature to work around that where new data will only be fetched every 24 hours using some sort of timer.
This visualization consists of a single screen containing a spinning globe (a) and interactive pie charts (b).

The globe allows the user to visualize the locations of the top ranked players. The pie charts can be toggled to see the different stats of each player. The text (c) under each pie chart will display the actual number data from the pie chart along with the player's best trophy score. The text on the far right (d) lists more detailed instructions to help the user navigate through the page.
Day 1:
- Set up project's webpack
- Figure out how to retrieve information from Clash Royale API
- Go through tutorials for D3
Day 2:
- Set up the spinning globe feature using D3
- Retrieve data from Clash Royale API to mark locations on globe
Day 3:
- Set up pie charts for win rates for various game modes
- Set up toggle feature or some other UI so switch between graphs
Day 4:
- Clean up features and make page visually appealing