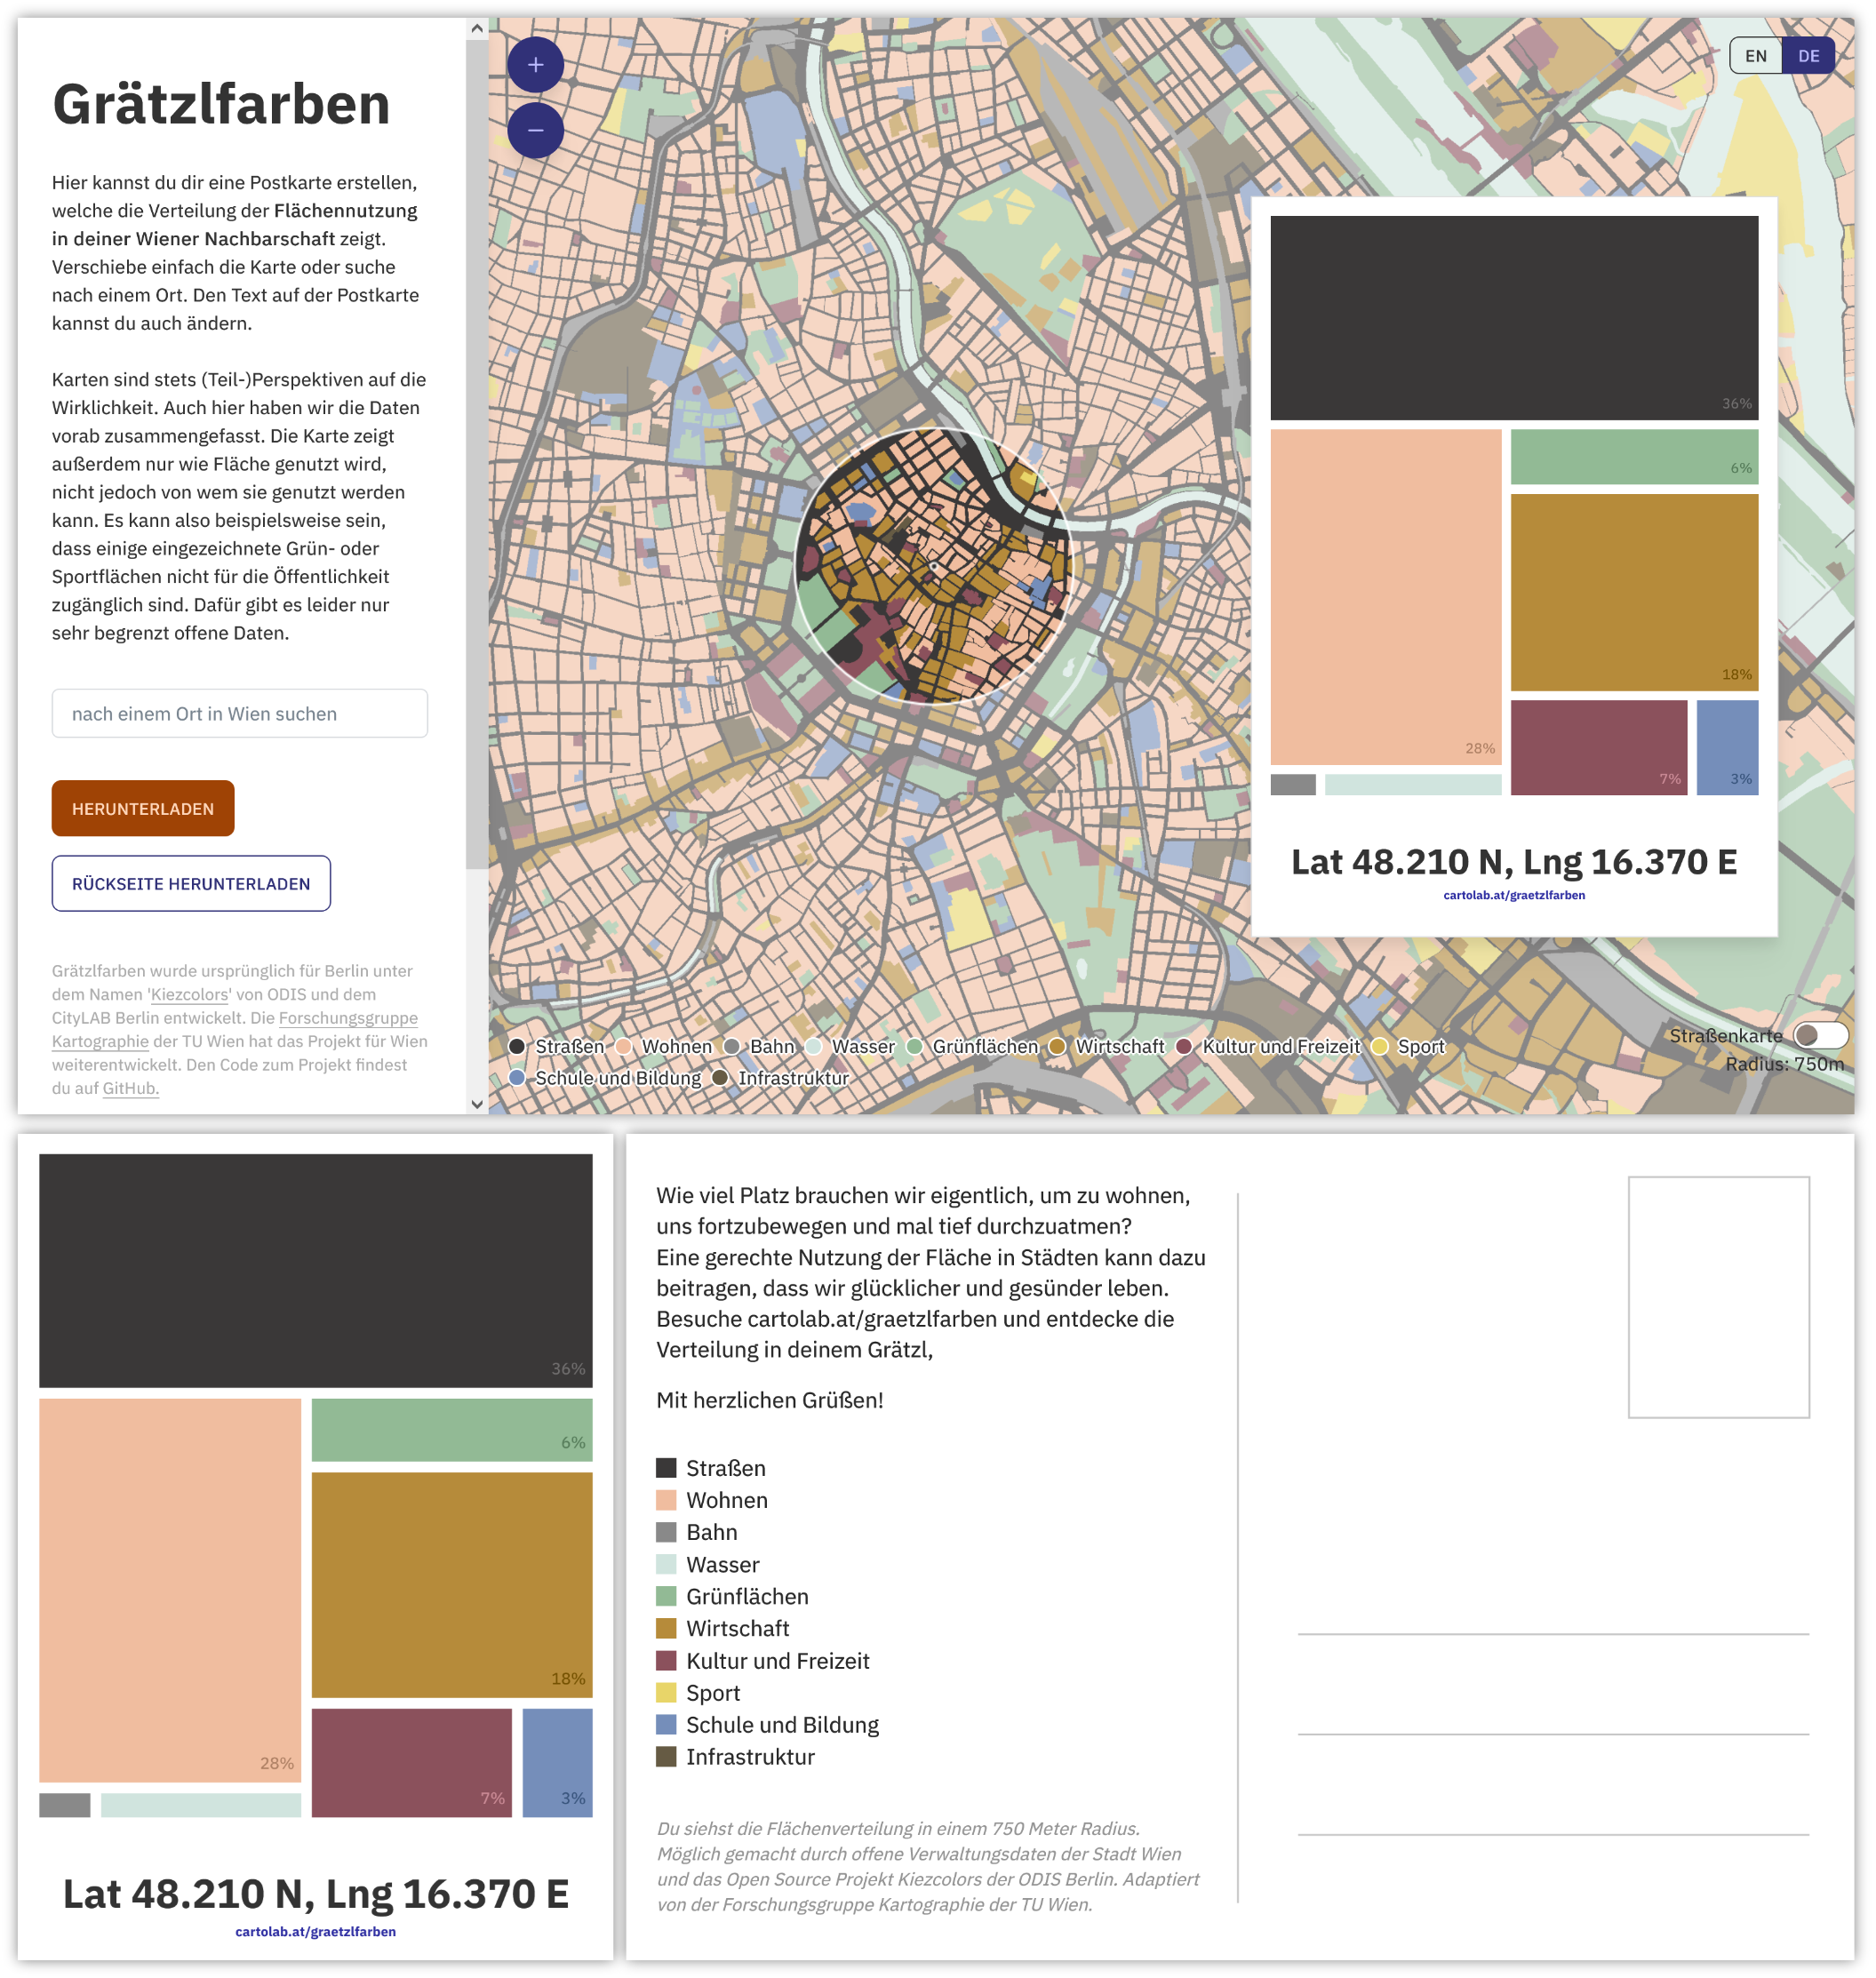
Grätzlfarben is a map based tool that creates a postcard showing the landuse distribution in your neighborhood in Vienna. It is based on the Kiezcolors tool of the Open Data Informationsstelle Berlin. By zooming in and out you can pick a location and position it inside the circle. Grätzlfarben then maps the individual areas onto a tree map diagram. You can print the resulting motive as a postcard and share it!
This website is a Svelte app. The map is rendered using MapLibre GL JS with vector tiles, and the analysis is done using Turf.js. The app is built as a fully static app and does not require any active server technology.
Install dependencies by running:
npm installStart a development server by running:
npm run devor start the server and open the app in a new browser tab
npm run dev -- --openTo create a production version of your app:
npm run buildYou can preview the production build with npm run preview.
To deploy your app, simply copy the build folder to your web server.
For Vienna, the 'Realnutzungskartierung' dataset by the City of Vienna is suitable for the application and available as a WFS. QGIS can be used to project it to EPSG:4326 and save it (with layername 'landuse-data') as GeoJSON, which is required to create the vector tiles for the map.
The most detailed information on landuse was used, based on the NUTZUNG_CODE or the NUTZUNG_LEVEL3 column.
The tiles were created with tippecanoe. To use tippecanoe on Windows, you need to install Ubuntu
To then use tippecanoe, open the Ubuntu shell, change directory to c/ by cd ../../mnt/c, change directory to tippecanoe folder and sudo make install, enter sudo password.
After changing to the directory where the input file is located, you can make the tiles by running the following command:
tippecanoe --output-to-directory ./tiles --layer "landuse-data" --no-tile-compression --force --minimum-zoom=10 --maximum-zoom=13 ./{input-file}.geojsonYour input data has to be in GeoJSON format and in the EPSG:4326 projection.
The landuse data Realnutzungskartierung Wien 2022 can be downloaded from the Open Data Portal Austria and is licenced under CC BY 4.0 DEED.
The application is built to be easily implemented in other cities if suitable data is available. All variables to be adapted can be found in src/lib/settings.js. The texts can be changed in 'src/locales. Images and tiles have to be exchanged in 'src/static'.
For use in public settings, Grätzlfarben can be run in "kiosk mode", which offers a single print button instead of download buttons for the postcard images. Only printing the postcard front (the treemap visualizaton) is supported in kiosk mode -- it is assumed that postcards pre-printed with the back side are provided on site.
To activate kiosk mode in the app, append the ?kiosk url parameter before the # sign in the url, for example:
http://localhost:5173/?kiosk#13/48.20996/16.3704
You can start most browsers in kiosk mode, which causes the app to be displayed in full screen, disables any user interface elements, and supports printing without showing a dialog. E.g. for Firefox, the command to launch the app in kiosk mode would be:
"C:\Program Files\Mozilla Firefox\firefox.exe" -kiosk -private-window https://cartolab.at/graetzlfarben/?kiosk
Before you create a pull request, write an issue so we can discuss your changes.
ODIS Berlin / CityLAB Berlin has made the biggest contribution by developing and coding the initial Kiezcolors tool. On part of the research unit cartography at TU Wien, Ester Scheck and Florian Ledermann mostly worked on the code and the documentation while Sacha Schlumpf and Andrea Binn supported with feedback and brainstorming ideas.
If you have any questions, please contact ester.scheck@geo.tuwien.ac.at
Texts and content available as CC BY.
