Interactions encode as binary tree terms behavioral models similar to Message Sequence Charts and UML Sequence Diagrams. For a formal semantics of interactions, see this paper.
HIBOU implements various features to manipulate interactions.
In this repository, we benchmark and compare two distinct methods for generating Non-deterministic Finite Automata from interactions. See also this paper.
An incremental approach roughly consists in using a Structural Operational Semantics (SOS) of interactions to execute it (one atomic action at a time). From the Control Flow Graph thus explored, we build a NFA which set of states correspond to the set of derivative interactions that can be reached (via the successive execution of actions) from the initial. Term rewriting is further utilized to merge semantically equivalent derivatives so as to reduce this number of states on the fly.
A compositional approach roughly consists in mapping interaction operators to classical NFA operators (e.g. strict sequencing to concatenation, loops to kleene star etc.) and building a NFA recursively from the leaves of the interaction term to its root. A strong limitation of this approach is that there are no equivalent NFA operators for some interaction operators (in particular weak sequencing and all the operators that are related to it (e.g., concurrent regions, weakly sequential loops etc.)). Thus this method can only be applied on a subset of interactions which satisfy specific constraints.
In order to compare these two methods, we thus restrict ourselves to a certain subset of interactions which are bounded (i.e. no process divergence) and local-choice (i.e. approximating weak sequencing as strict sequencing outside basic sub-interactions has no effect on the trace language).
What we compare concerns the size (in number of states) of the NFA synthesized using both methods.
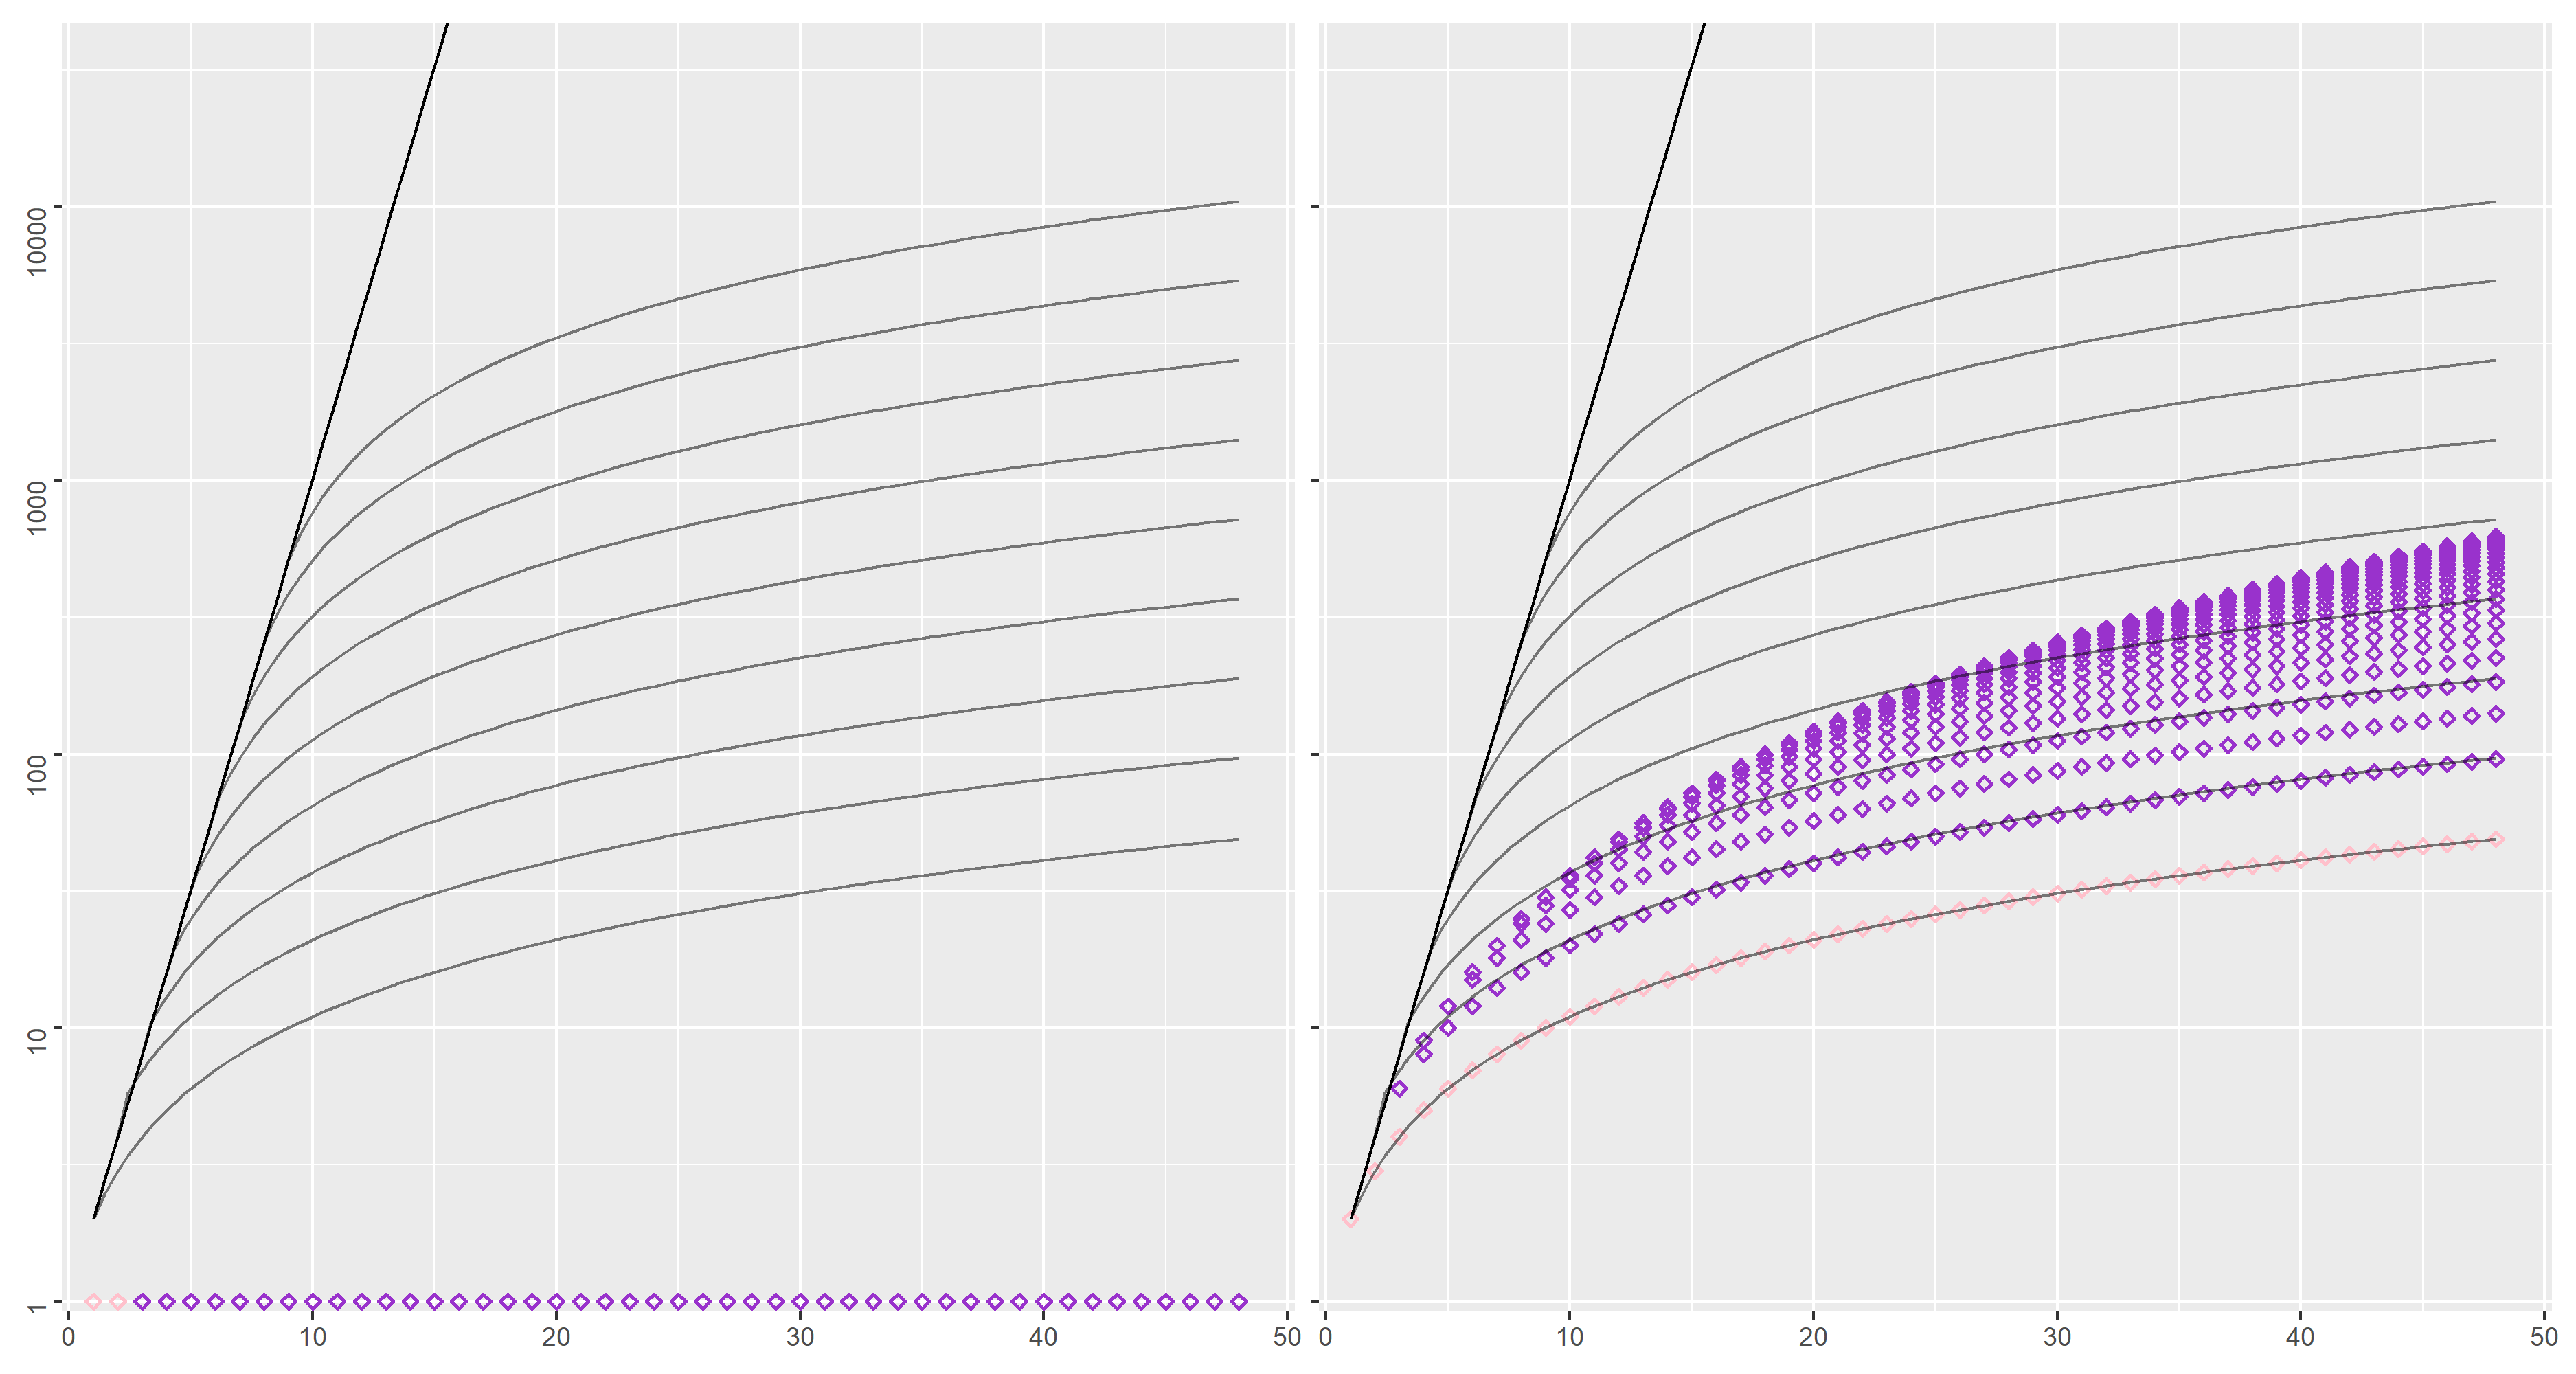
In order to set a scale and thus improve the understanding of the size of generated NFA against that of the corresponding input interactions, we use the common grid represented below.
The
The straight black line on the left corresponds to the function
The
On the diagram, the position of each of the
With these simple interactions, both approaches to generating NFA (incremental and compositional) trivially return the minimal NFA.
Indeed, for
We remark that, depending of the value of
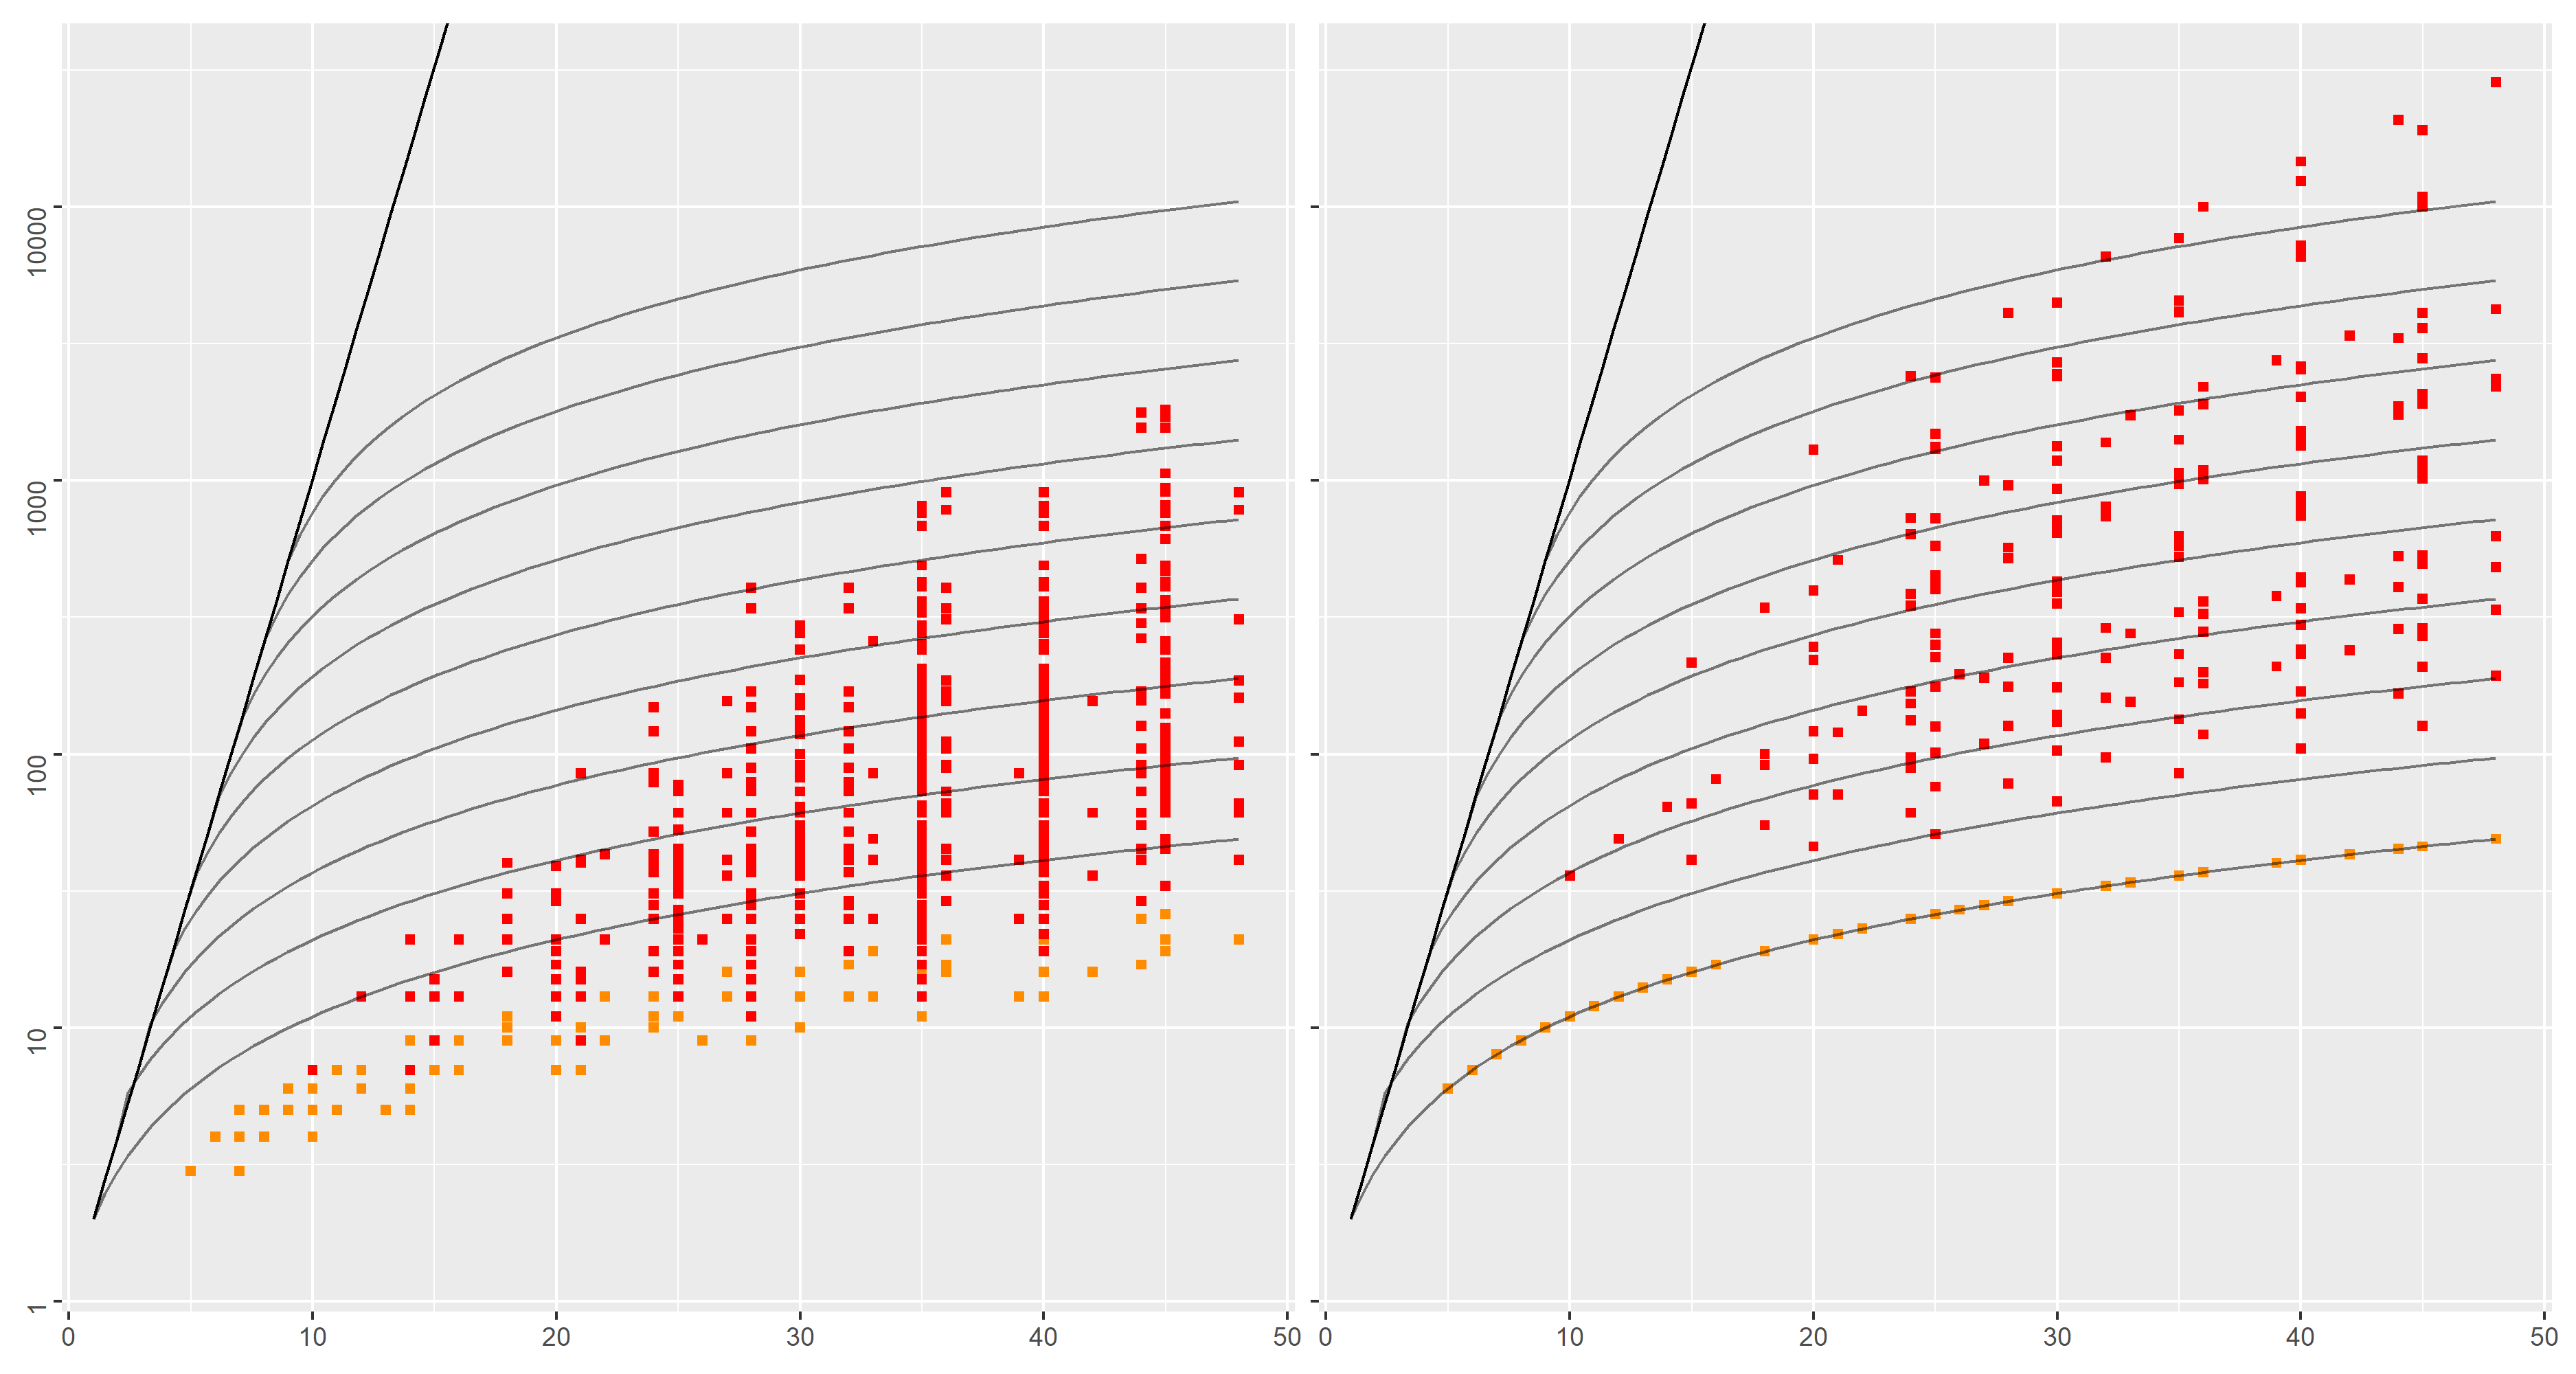
We will use the grid to compare both approaches on 3 datasets. For each dataset, we will present two diagrams:
- the diagram on the left plots the results of using the incremental method on the dataset
- the diagram on the right plots the results of using the compositional method on the dataset
As both diagrams have the same referential and grid, it is easy to compare the approaches by comparing the
Because the
- pink instead of purple for the first dataset
- orange instead of red for the second
- with a lighter shade of green for the third
We consider a first dataset (named "loop-alt") with interactions of the form
Using the incremental approach, whichever are the numbers
This is not the case for the compositional approach,
in which the number of states grows rapidly with the number of actions and the degree of parallelization
(up to
We now consider a `locks' dataset, which adapts a well-known regular expression example into digital lock use cases. See also this repository for further details.
A digital lock is represented by an interaction
In order to open the lock, a correct sequence of
Several such locks may then be composed either strictly sequentially, or in parallel.
The dataset is built by varying the number of locks, how these locks are related (via
Minimal DFA associated to such interactions have exponentially more states than their NFA counterpart. Experimental results show that the incremental approach limits this state space explosion, which is less visible for the compositional approach.
The diagram above summarizes results on a "random" dataset, containing randomly generated interactions.
This roughly consists in drawing symbols (i.e. symbols of the interaction language) recursively until an interaction term is built.
Special cases are made to ensure finite depth and that we have
We considered
While the first two datasets ("loop-alt" and "locks") contain interactions with specific structures that could advantage the incremental approach, the "random" dataset does not. Still, experimental results shows that the incremental method consistently outputs smaller NFAs than the compositional approach.
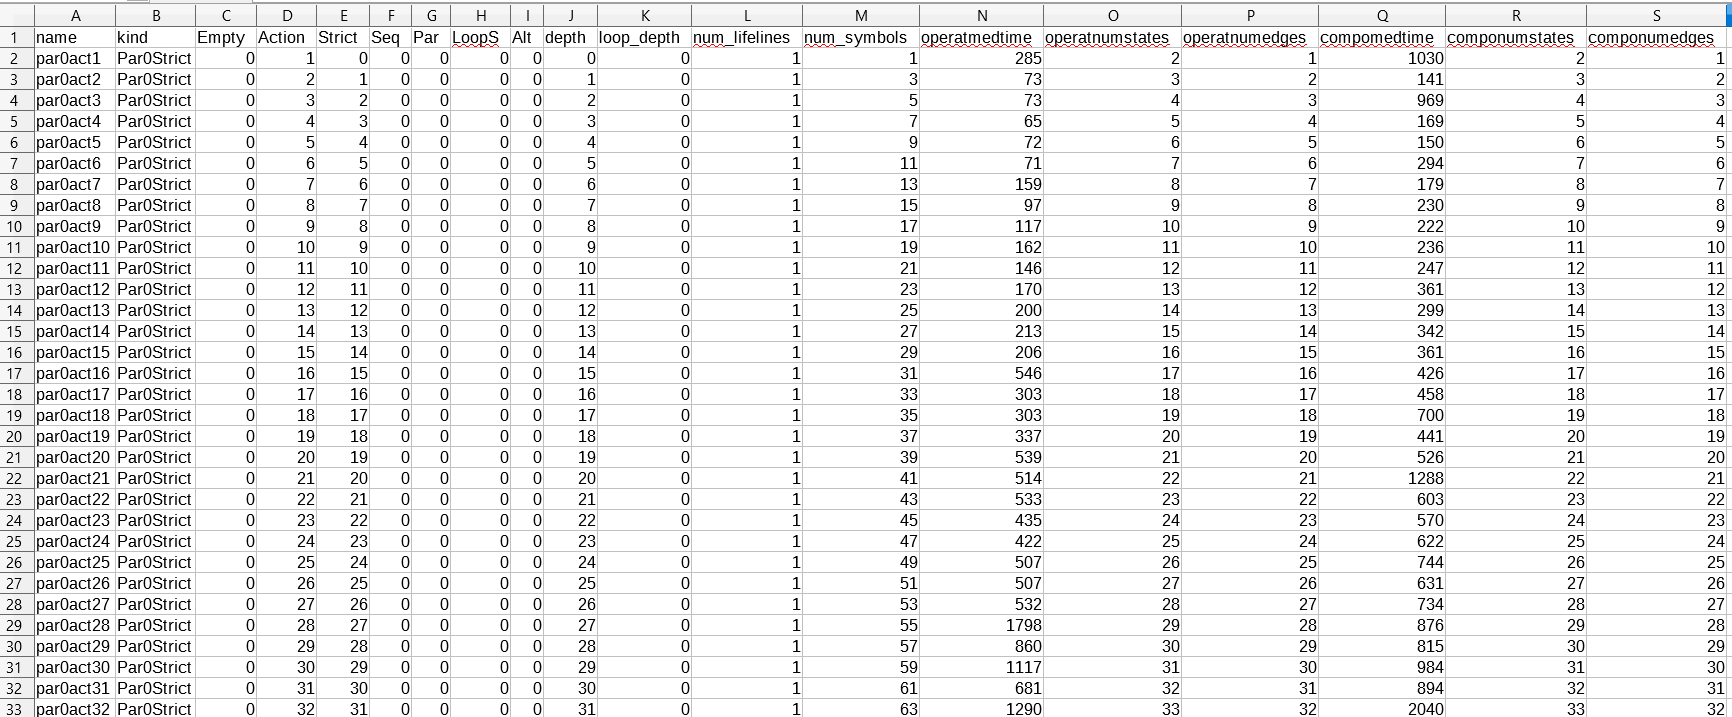
The raw data used to plot the diagrams above is given in the "precomputed_data.csv" file.
A partial screenshot of this raw data is given below.
Each row corresponds to an interaction / a datapoint in the above diagrams.
Each column corresponds to an attribute associated to the datapoint (there are much more attributes than the ones used to plot the diagrams).
The kind column specifies to which dataset the interaction belongs:
- all the ParXStrict interactions belong to the unnamed dataset used to draw the common grid
- all the LoopAlt and LoopAltNoPar interactions belong to the "loop-alt" dataset
- all the Doors and DoorsNoPar interactions belong to the "locks" dataset
- all the Random and RandomNoPar interactions belong to the "random" dataset
The Action column gives the number of atomic actions contained in the syntactic structure of the interaction.
It gives the
The operatnumstates column gives the number of states of the NFA synthesized using the incremental/operational method.
It is used for the
The componumstates column gives the number of states of the NFA synthesized using the compositional method.
It is used for the
In order to redraw the diagrams, you can use the R script in "nfagen_plot.r" as follows:
Rscript nfagen_plot.r
or, on windows / Powershell :
Rscript.exe .\nfagen_plot.r
With the HIBOU tool executable in the repository you can use the nfa_experiment2 command to regenerate the data.
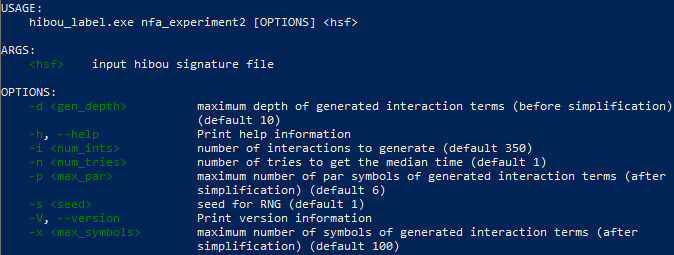
You can access the help of the command as follows:
./hibou_label.exe nfa_experiment2 -h
Which outputs the following, which explains what are the available options etc.:
The input hibou signature file is used to define the signature of the randomly generated interactions (for the "random" dataset). In the experiments presented above, the signature in the file "signature.hsf" has been used.
Hence, in order to reproduce the experimental data from the file "precomputed_data.csv", you may simply type:
./hibou_label.exe nfa_experiment2 .\signature.hsf
It is possible that you do not get the same randomly generated interactions due to platform specific issues with RNG. Still, on a fixed platform, setting the seed should enforce the generation of the same "random" dataset each time.
After running the command, a file "signature_exp.csv" or any "X_exp.csv" file depending on the name of the "X.hsf" signature file will be generated. This ".csv" file can then be used as input for the R script via modifying it on line 214.


