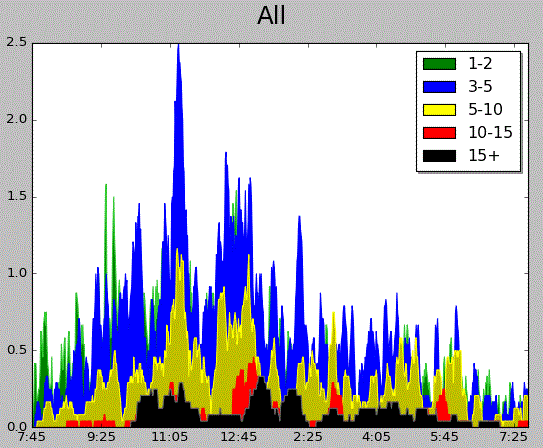
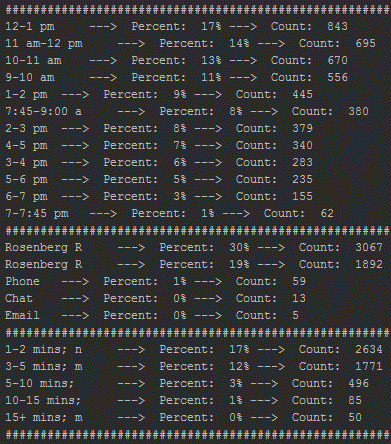
Statistics and visualization for City College of San Francisco's reference desk.
Run ref_stats.py from the command line with the path to your csv file as an argument.
python stats.csv
This will create a vizualization of the data as well as create some statistics on the command line.
Options:
Modify the DAYS global variable to specify the date range and number of charts to be built.
One chart is built for each entry, passed in as an array.
Valid inputs are dates: "02-22-2016", day names (shows stats for all instances of that day, in this case all Mondays): "mondays" and all: "all"
ex) DAYS = ["all", "mondays", "02-22-2016"]
- Fork it!
- Create your feature branch:
git checkout -b my-new-feature - Commit your changes:
git commit -am 'Add some feature' - Push to the branch:
git push origin my-new-feature - Submit a pull request
Thanks to @scoofy for the help creating the area charts and time axis.


