Cable Modem Data, how to record and plot, simplified
2017-04-13 paul chevalier
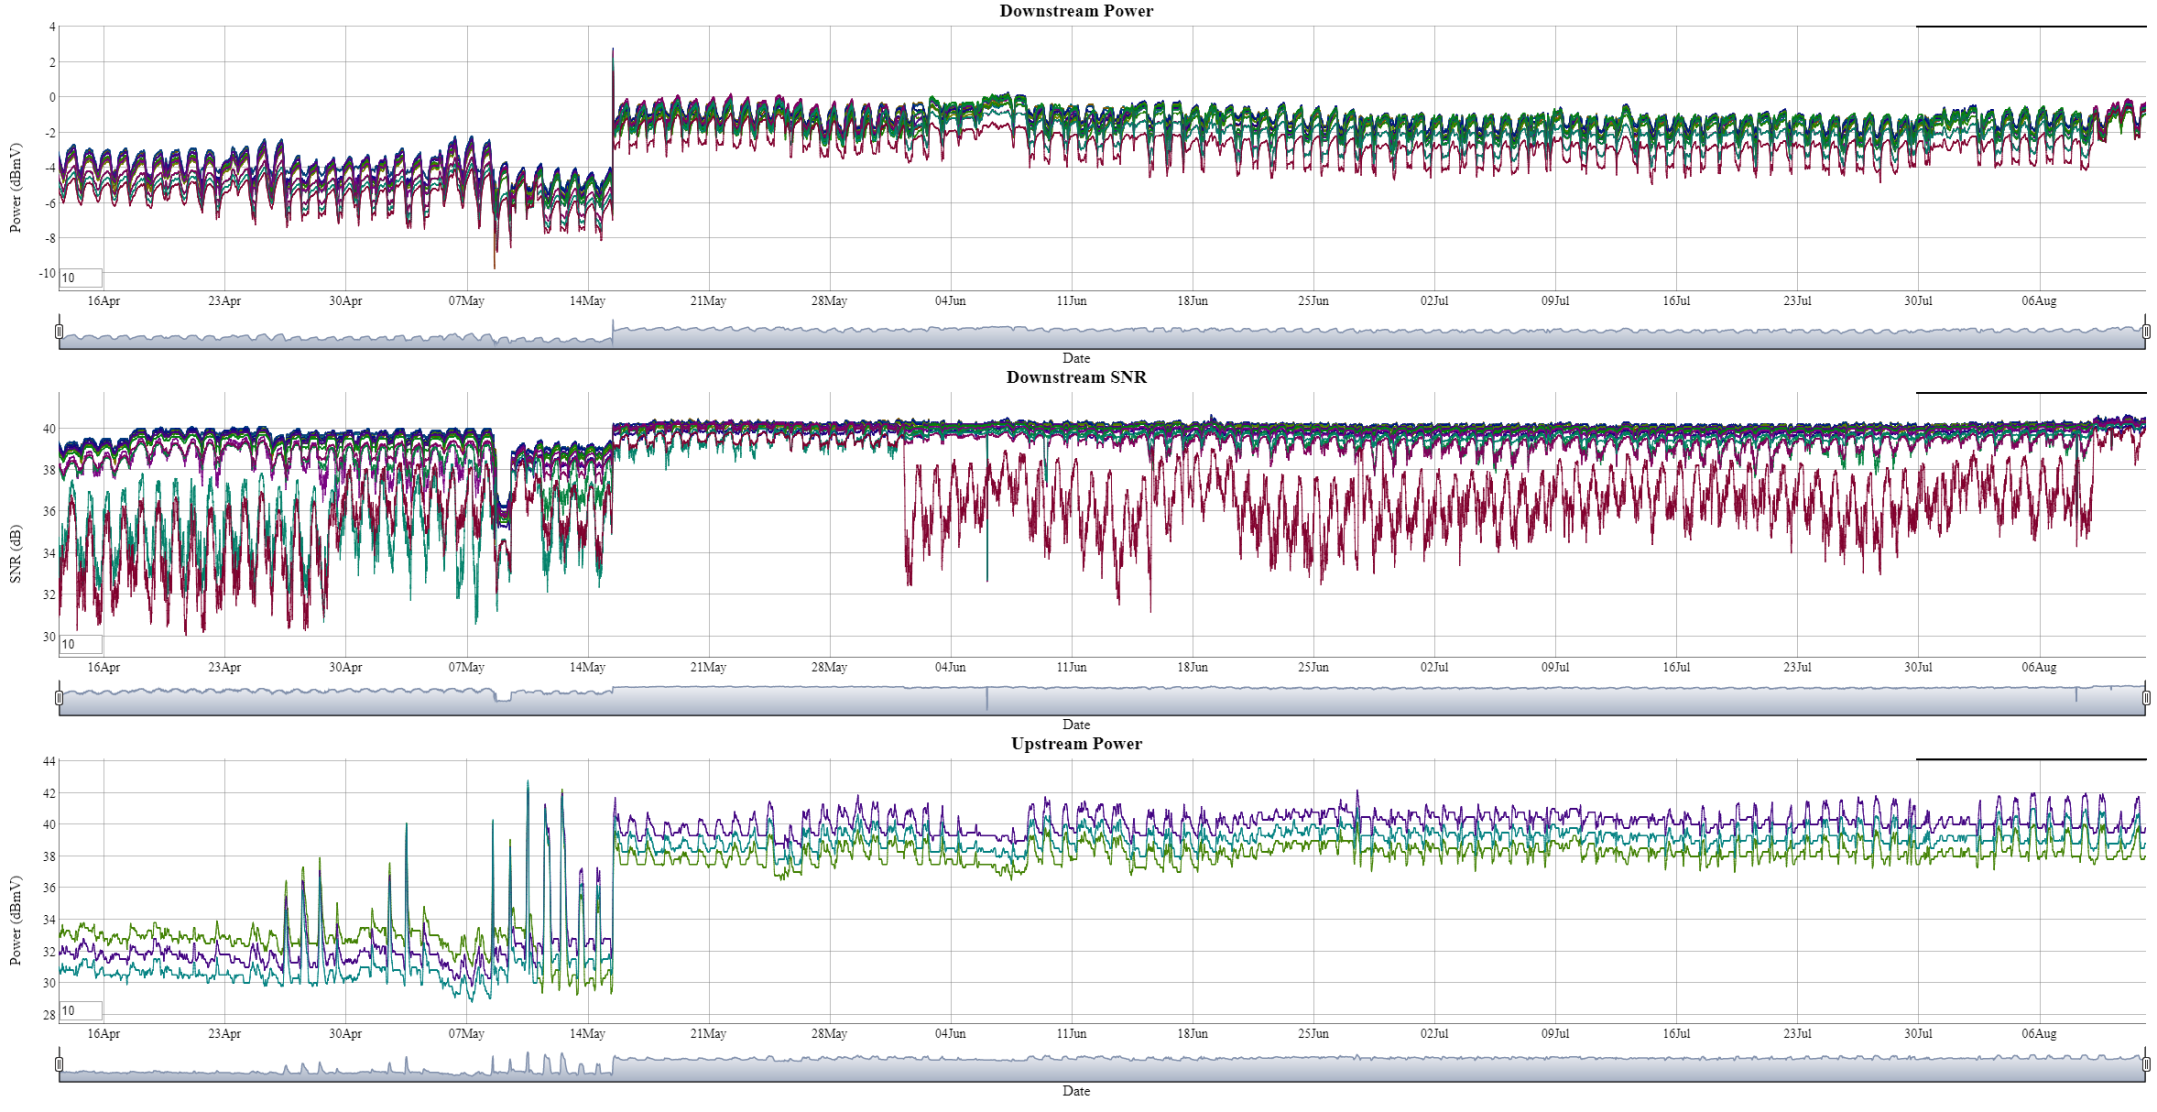 Select the image above to present a live graph instance using example data files within this repository (give it a while to display, there're a lot of datapoints to render). Try out the rolling average entries(lower left of each graph, default=10), and use the range selector bars under each graph(far left and right) to zoom in and move around the timeline. (note that the page auto-refreshes every 5 minutes)
The Goal:
Persistently capture and record statistics from an Arris SB6183 cable modem, and display historical plots in dygraphs.
Method Overview:
- Periodically run the cableModemCapture-SB6183.sh shell script via cron.
- The script uses the lynx text-based web browser to capture statistical data from the cable modem.
- It parses the data to extract target numerical data.
- Then appends the timestamped numerical data to running CSV data files.
- Graphic plots (using Dygraphs) of the accumulated data are produced in realtime.
Requirements/Dependencies:
- An Arris SB6183 cable modem to capture data from
- A linux instance, or equivalent
- dygraph-combined.js
- A local web server(optional) running on the linux instance
Operational files:
- cableModemCapture-SB6183.sh (typically run every 5 minutes via cron)
- index.html
- dygraph-combined.js
- crontab entry
Data files: three running csv data files are appended to every time the shell script is run:
- DownPowerLevels.csv
- SNR-Levels.csv
- UpPowerLevels.csv
The index.html file references those csv files, and uses dygraphs to produce graphic plots.
A recommended implementation is to run this off a Raspberry-pi with a small UPS, as it’s useful for portability, persistence, and low power consumption. (most any host system can use this method, it only uses a basic shell, lynx, sed, grep, cut, dygraphs, and a scheduler)
Example file structure on Raspberry-pi:
/var/www/html
├── dygraph-combined.js
├── index.html
├── SB6183
│ ├── CableModemCapture-SB6183.sh
│ ├── DownPowerLevels.csv
│ ├── SNR-Levels.csv
│ └── UpPowerLevels.csv
example crontab -l :
0,5,10,15,20,25,30,35,40,45,50,55 * * * * /bin/bash /var/www/html/SB6183/CableModemCapture-SB6183.sh
While the parsing parameters in the capture script are specific to an Arris SB6183 cable modem, they can easily be modified for other modems or devices that can produce a repeatable pattern of data via a URI. To do that, use lynx to dump a text file of the target device data. Then open the text file in an appropriate editor (e.g. notepad++) to easily determine the line numbers and field positions of the target data, and then adjust the parsing parameters in the capture script.
A typical parse event in the script performs a piped sequence of operations against the lynx-captured dump file similar to this:
- use sed to trim to a target range of line numbers:
sed -n '23,38 p'
- use grep to trim to lines that contain a target text identifier:
grep dBmV
- use sed to shrink multiple whitespace in each line:
sed 's/ */ /g'
- use cut with a whitespace delimiter and extract the target field of numerical data:
cut -d" " -f 10
- use sed to transpose the extracted data into a single csv line:
sed -e :a -e '/$/N; s/\n/,/; ta'
- append the timestamped csv line to the target cumulative csv file
Note that running a web server is only needed if you intend to view the plots via a browser from any system on your lan(preferred). You instead could just view the plots on the hosting system by pointing firefox to the local index.html file. (note that the non-web server method doesn’t work with Chrome browser because it disallows cross origin requests)