plotseries – Time-Series Plots
Plot financial time-series, such as a portfolio value or stock price. The package provides a single function, plotseries(), that creates high-quality, informative, but uncluttered graphics. Multiple series can be aggregated into fanplots, the code for which is based on chapter 15 of ”Numerical Methods and Optimization in Finance”, second edition, by M. Gilli, D. Maringer and E. Schumann (2019, ISBN:978-0128150658). Also supported is plotting streaks, i.e. periods of uninterrupted up or down movement.
Installing the package
The latest build of the package is always available from http://enricoschumann.net/R/packages/plotseries/index.htm.
To install the package from within an R session, type:
install.packages("plotseries",
                 repos = c("http://enricoschumann.net/R",
                           getOption("repos")))
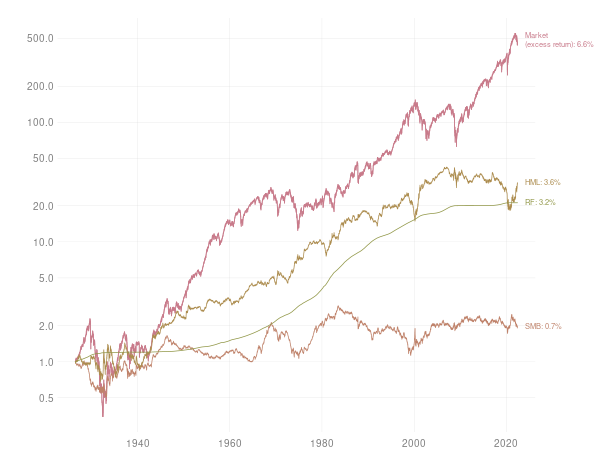
Examples: Fama-French factors
library("plotseries")
library("NMOF")   ## provides function 'French'

## fetch data
series <- French("~/Downloads/French/",
                 "F-F_Research_Data_Factors_daily_CSV.zip",
                 frequency = "daily",
                 price.series = TRUE)

## plot
plotseries(series,
           t = as.Date(row.names(series)),
           col = hcl.colors(n = 12, palette = "Dark 2"),
           log.scale = TRUE,
           par.list = list(ps = 10),
           labels = c("Market\n(excess return)",
                      "SMB", "HML", "RF"),
           labels.col = TRUE)
More examples are in the package vignette.
News, feedback and discussion
Please send bug reports or suggestions directly to the
package maintainer, for instance by using bug.report.
library("utils")
bug.report("[plotseries] Unexpected behaviour in function XXX",
           maintainer("plotseries"), package = "plotseries")