This repo includes data and code required to replicate the results in the paper "County-Level Estimates of Excess Mortality Associated with COVID-19 in the United States". [Link to Pre-Print]
In order to predict the expected mortality in 2020, we estimated a statistical model of mortality using historical mortality data from 2011-2019. Specifically, we modeled mortality at the county-set-year level using a quasi-poisson generalized linear model (QP-GLM) of the following form:
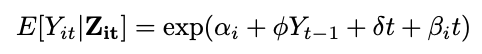
- Yit represents the number of all-cause deaths divided by the total population of county i in year t.
- αi denotes a county-set-specific intercept term, which captures latent characteristics of each county-set that may be correlated with mortality. Importantly, this term picks up relevant information such as the distribution of age and health in each county-set.
- Yt−1 one lag of the dependent variable to capture potential serial correlation in mortality.
- t represents time
- βi allows the time trend to vary across county-sets. This accounts for the evolving distribution of age and other demographic characteristics across granular geographies that may be related to mortality.
-
code/import_and_synth_raw_data.R load 2020 county-level provisional data (Note this file is exactly: https://data.cdc.gov/NCHS/AH-County-of-Residence-Provisional-COVID-19-Deaths/75vb-d79q). Load yearly mortality files downloaded from CDC Wonder.
-
code/estimate_poisson_pred_deaths_cs_annual.R estimates the all cause mortality at baseline (2011-2019) and in 2020 on county set data. Import analysis data 'county_set_analysis_data_2011_2019_W2020_wash_6_3.csv' created in "import_and_synth_raw_data".
code/master_fig.R runs all the following scripts to reproduce tables and figures in the paper. All output files are in output/.
- code/prelim_plot.R loads packages and common functions to run the scripts.
- code/0_build_final_data_with_county.R converts the county-set level data (each row represents a county set) to county level (each row represents a county). It also matches the metropolitan status and BEA region to each county.
- code/1_make_summary_table.R produces Table 1, Table A1 (output/tab1_input.tex), and appendix Table C1 (output/atab_c1_county_estimate_input.tex ). It calculates the weighted mean of key variables at different geographical levels. The variables include expected deaths, observed deaths, ratio of observed to expected deaths, excess deaths, excess deaths rate, COVID-19 deaths, ratio of COVID-10 to excess deaths, and number of county sets in each geographical level.
- code/2_make_histogram.R produces Figure 1 (output/fig1_hist_2011_2020.png). It plots the distribution of all-cause death rate, excess death rate, and excess death rate excluding COVID-19 for 2011-2020.
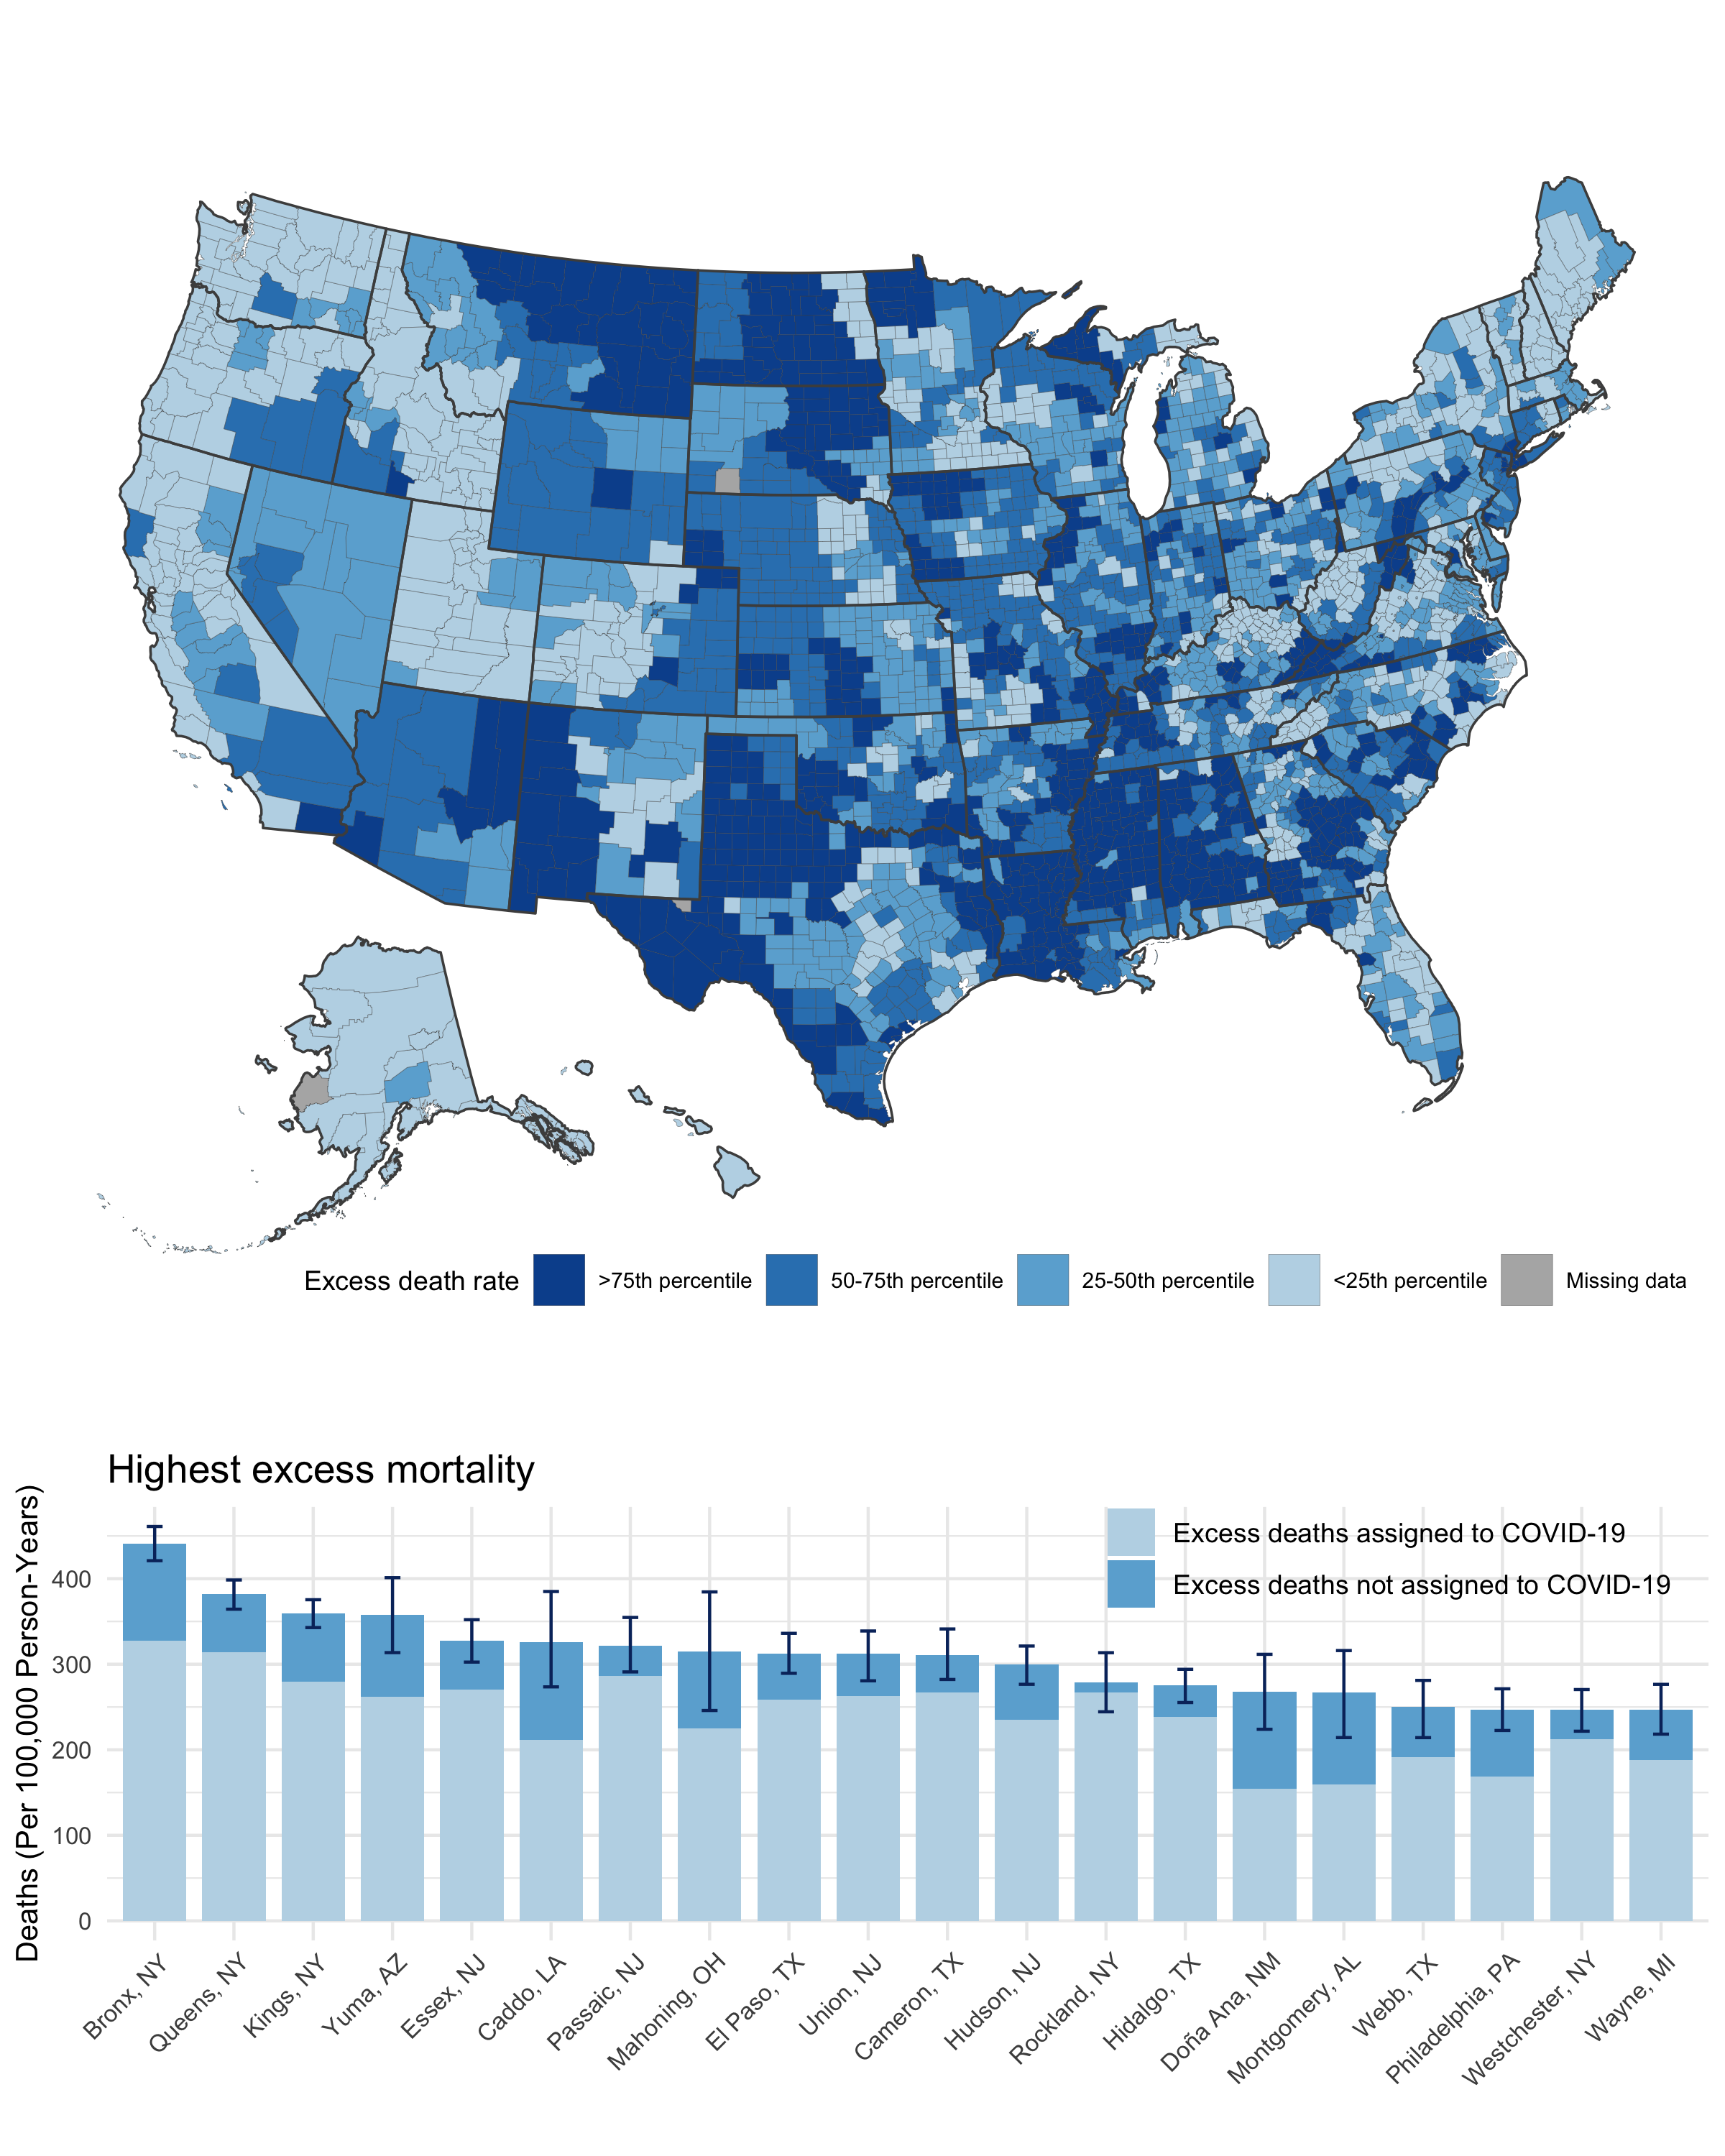
- code/3_make_map.R produces Figure 2 (output/fig2_excess_death_map_bar.png) and Figure 3 (output/fig3_excess_not_covid_map_bar.png). It plots the county level map of excess death rate and percent of excess deaths not assigned to COVID-19, along with the 20 counties with the highest excess deaths and 20 counties with the lowest COVID-19 to excess ratio.
- code/4_make_scatterplot_deathrate.R prodcues Figure 4 (output/fig4_covid_excess_rate_scatterplot_region.png). It plots the COVID-19 death rate against excess death rate for each county set by metropolitan status and BEA region.
- code/5_make_bar_excessnotcovid_county.R produces Figure 5 (output/fig5_excess_not_covid_strict_negative.png). It plots the 20 county sets with the highest excess death rate not assigned to COVID-19 and 14 county sets with strictly negative (confidence intervals below zero) excess death not assigned to COVID-19.
- code/6_make_bar_excess_by_region.R produces appendix Figure 1 (output/afig1_excess_regionmetro_bar.png). It plots excess death rate and ratio of COVID-19 to excess deaths by BEA region and metropolitan status.
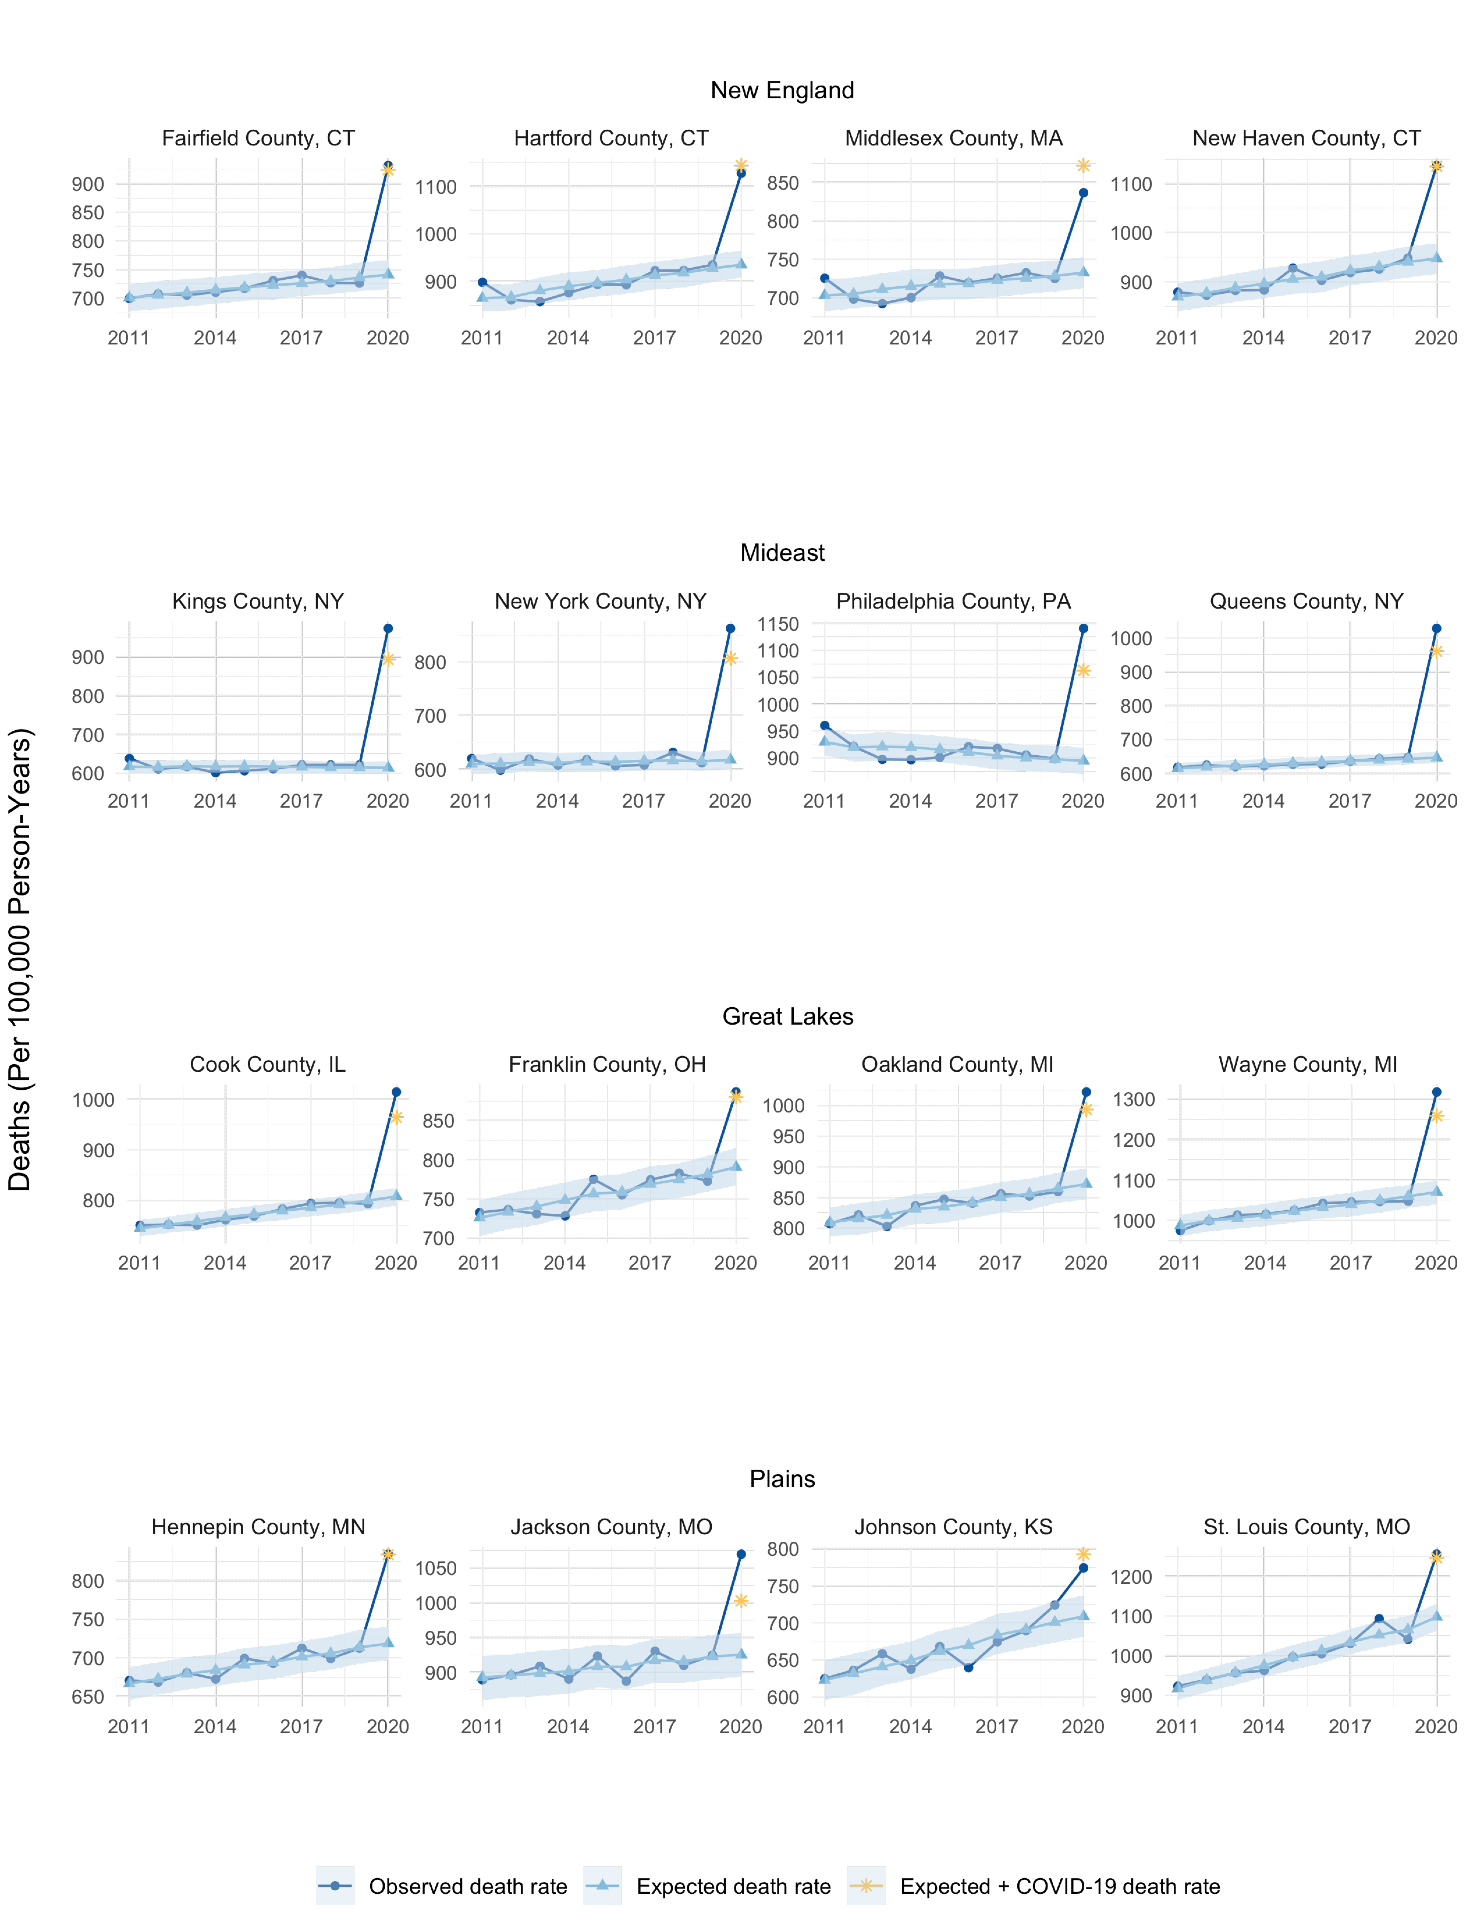
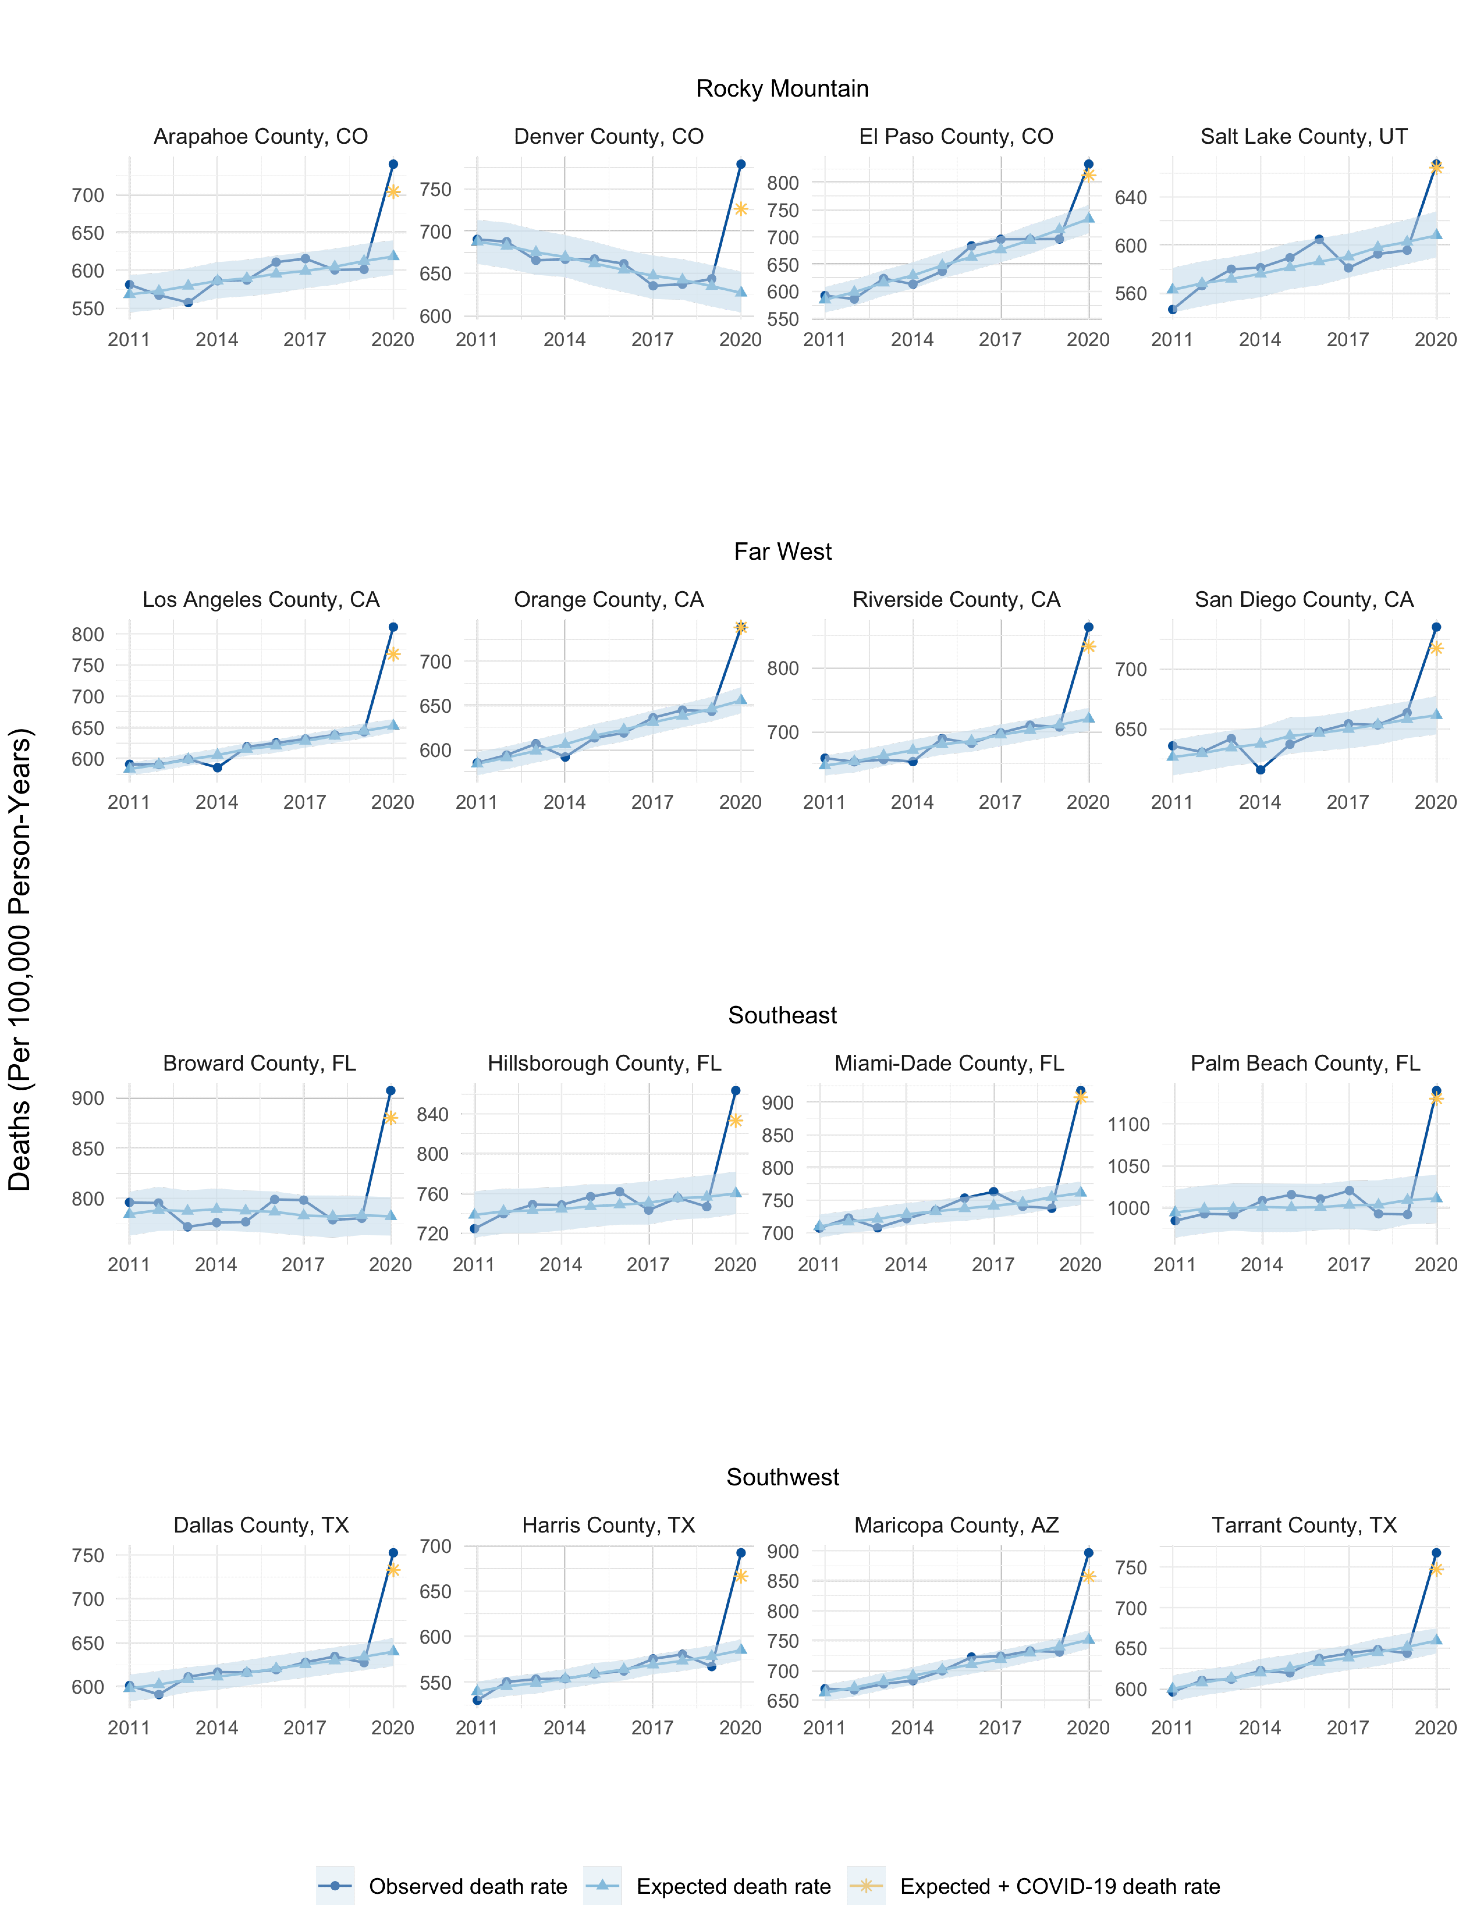
- code/7_make_time_series_plots.R produces appendix Figure 2 and 3 (output/afig_time_series_stacked1.png and afig_time_series_stacked2.png). It plots the time series of observed and expected deaths of the four most populous counties in each BEA region.
- code/8_make_cum_pop_table.R produces appendix Table A2 (output/atab_a2_covid_excess_ratio_pop.tex). It tabulates the number of population living in counties with different levels of assignment of excess deaths to COVID-19.
- code/9_make_countyset_estimate_table.R produces appendix Table C1 (output/atab_c1_county_estimate_input.tex). It tabulates the key variables for each county set. The variables are identical to the ones in Table 1.
- The folder
raw_data/contains geographic crosswalks between county, county set, BEA region, and metropolitan status. - The folder
final_data/includes final clean data used in the analysis.- fitted_and_actual_deaths_county_sets_2020_W2020_wash_6_3.csv contains actual deaths and estimated expected deaths at county set level in 2020.
- fitted_and_actual_deaths_county_sets_2011_2020_W2020_wash_6_3.csv contains actual deaths and estimated expected deaths at county set level between 2011 and 2020.
- 2020 county-level provisional data file is exactly: https://data.cdc.gov/NCHS/AH-County-of-Residence-Provisional-COVID-19-Deaths/75vb-d79q.
- Yearly mortality files are downloaded from CDC Wonder.