Source Repo: https://github.com/emin100/sql_anonymizer
Releases(For Compiled Binaries): https://github.com/emin100/sql_anonymizer/releases
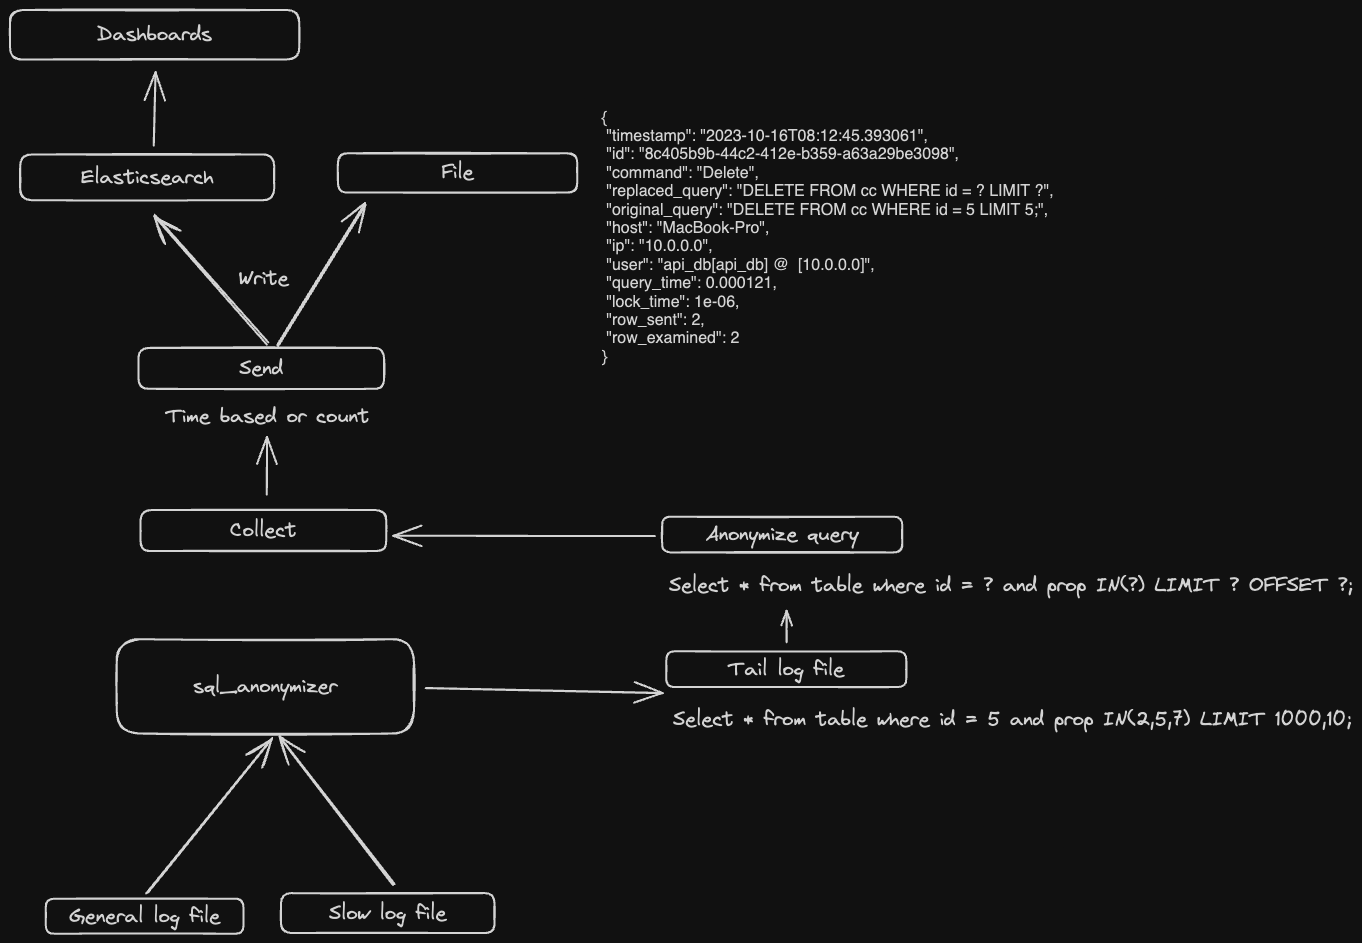
- Listen to log files. (Please check log lines in format section)
- Create SQL Abstract Syntax Tree. For example:
AST: [Query(Query { ctes: [], body: Select(Select { distinct: false, projection: [UnnamedExpr(Identifier("a")), UnnamedExpr(Identifier("b")), UnnamedExpr(Value(Long(123))), UnnamedExpr(Function(Function { name: ObjectName(["myfunc"]), args: [Identifier("b")], filter: None, over: None, distinct: false }))], from: [TableWithJoins { relation: Table { name: ObjectName(["table_1"]), alias: None, args: [], with_hints: [] }, joins: [] }], selection: Some(BinaryOp { left: BinaryOp { left: Identifier("a"), op: Gt, right: Identifier("b") }, op: And, right: BinaryOp { left: Identifier("b"), op: Lt, right: Value(Long(100)) } }), group_by: [], having: None }), order_by: [OrderByExpr { expr: Identifier("a"), asc: Some(false) }, OrderByExpr { expr: Identifier("b"), asc: None }], limit: None, offset: None, fetch: None })]- Change
Valuetype toValue::Placeholderin AST - Rewrite sql from AST.(Please check outputs in format section)
- Send log to elasticsearch or file
Download compiled binary in the release page or build with cargo build command.
Usage: sql_normalizer-arm-macos send [OPTIONS] --input <INPUT>

Options:
  -e, --elastic-host <ELASTIC_HOST>
          Elastic host. Env: ELASTIC_HOST [env: ELASTIC_HOST=]
  -l, --log-level <LOG_LEVEL>
          Turn debugging information on [default: error]
  -u, --elastic-user <ELASTIC_USER>
          Sets Elastic username [env: ELASTIC_USER=]
  -p, --elastic-password <ELASTIC_PASSWORD>
          Sets Elastic password [env: ELASTIC_PASSWORD=]
  -t, --output <OUTPUT>
          Sets an output type [default: file] [possible values: file, elastic]
  -i, --input <INPUT>
          Sets an input type [default: general] [possible values: slow, general]
  -f, --input-file <FILE>
          Sets a input file path
  -o, --output-file <FILE>
          Sets a output file path [default: output.txt]
  -s, --elastic-push-size <ELASTIC_PUSH_SIZE>
          Sets a push size [default: 1000]
  -c, --elastic-push-seconds <ELASTIC_PUSH_SECONDS>
          Sets a push seconds [default: 15]
  -n, --elastic-index-name <ELASTIC_INDEX_NAME>
          Sets Elastic password [env: ELASTIC_INDEX=] [default: mysql_logs]
  -q, --query
          Log original query
  -h, --help
          Print help
- Export the elasticsearch information or add the command
export ELASTIC_PASSWORD=password
export ELASTIC_USER=username
export ELASTIC_HOST=https://hosts.com:9200
- Execute the binary
- For listen general log
sql_normalizer send -t elastic -i general -f ./instance1.log -c 600 -q
- For listen slow log
sql_normalizer send -t elastic -i slow -f ./instance1-slow.log -c 600 -q
- For listen general log
- Execute the binary
- For listen to general log
sql_normalizer send -t file -o output.txt -i general -f ./instance1.log -c 600 -q
- For listen to slow log
sql_normalizer send -t file -o output.txt -i slow -f ./instance1-slow.log -c 600 -q
- For listen to general log
- timestamp: Original log time.
- id: Log record identifier.
- command: The type of the queries.(Query,Insert,Update,Other,Explain,Delete)
- replaced_query: Changed query from the parser.
- original_query: Original query.
- host: The hostname of the instances.
- ip: The ip address of the client.
- user: The username of the user.
- query_time: The statement execution time in seconds.
- lock_time: The time to acquire locks in seconds.
- row_sent: The number of rows sent to the client.
- row_examined: The number of rows examined by the server layer (not counting any processing internal to storage engines).
These metrics are available and collectable by the parser.
-
Thread_id: The statement thread identifier.
-
Errno: The statement error number, or 0 if no error occurred.
-
Killed: If the statement was terminated, the error number indicating why, or 0 if the statement terminated normally.
-
Bytes_received: The Bytes_received value for the statement.
-
Bytes_sent: The Bytes_sent value for the statement.
-
Read_first: The Handler_read_first value for the statement.
-
Read_last: The Handler_read_last value for the statement.
-
Read_key: The Handler_read_key value for the statement.
-
Read_next: The Handler_read_next value for the statement.
-
Read_prev: The Handler_read_prev value for the statement.
-
Read_rnd: The Handler_read_rnd value for the statement.
-
Read_rnd_next: The Handler_read_rnd_next value for the statement.
-
Sort_merge_passes: The Sort_merge_passes value for the statement.
-
Sort_range_count: The Sort_range value for the statement.
-
Sort_rows: The Sort_rows value for the statement.
-
Sort_scan_count: The Sort_scan value for the statement.
-
Created_tmp_disk_tables: The Created_tmp_disk_tables value for the statement.
-
Created_tmp_tables: The Created_tmp_tables value for the statement.
-
Start: The statement execution start time.
-
End: The statement execution end time.
2023-09-20T14:14:38.673981Z 3481056 Query SELECT * FROM cc WHERE id = 5 LIMIT 0,10000
{
    "timestamp": "2023-09-20T14:14:38.673981",
    "id": "a66fde66-ae43-4dcf-8db5-44186c4e5458",
    "command": "Query",
    "replaced_query": "SELECT * FROM cc WHERE id = ? LIMIT ? OFFSET ?",
    "original_query": "SELECT * FROM cc WHERE id = 5 LIMIT 0,10000",
    "host": "MacBook-Pro",
    "ip": "10.0.0.0",
    "user": null,
    "query_time": null,
    "lock_time": null,
    "row_sent": null,
    "row_examined": null
}# Time: 2023-10-16T08:12:45.393061Z
# User@Host: api_db[api_db] @ [10.0.0.0] Id: 2182431
# Query_time: 0.000121 Lock_time: 0.000001 Rows_sent: 2 Rows_examined: 2 Thread_id: 2182431 Errno: 0 Killed: 0
Bytes_received: 142 Bytes_sent: 992 Read_first: 0 Read_last: 0 Read_key: 1 Read_next: 2 Read_prev: 0 Read_rnd: 0
Read_rnd_next: 0 Sort_merge_passes: 0 Sort_range_count: 0 Sort_rows: 0 Sort_scan_count: 0 Created_tmp_disk_tables: 0
Created_tmp_tables: 0 Start: 2023-10-16T08:12:45.392940Z End: 2023-10-16T08:12:45.393061Z
SET timestamp=1697443965;
DELETE FROM cc WHERE id = 5 LIMIT 5;
{
    "timestamp": "2023-10-16T08:12:45.393061",
    "id": "8c405b9b-44c2-412e-b359-a63a29be3098",
    "command": "Delete",
    "replaced_query": "DELETE FROM cc WHERE id = ? LIMIT ?",
    "original_query": "DELETE FROM cc WHERE id = 5 LIMIT 5;",
    "host": "MacBook-Pro",
    "ip": "10.0.0.0",
    "user": "api_db[api_db] @ [10.0.0.0]",
    "query_time": 0.000121,
    "lock_time": 1e-0,
    "row_sent": 2,
    "row_examined": 2
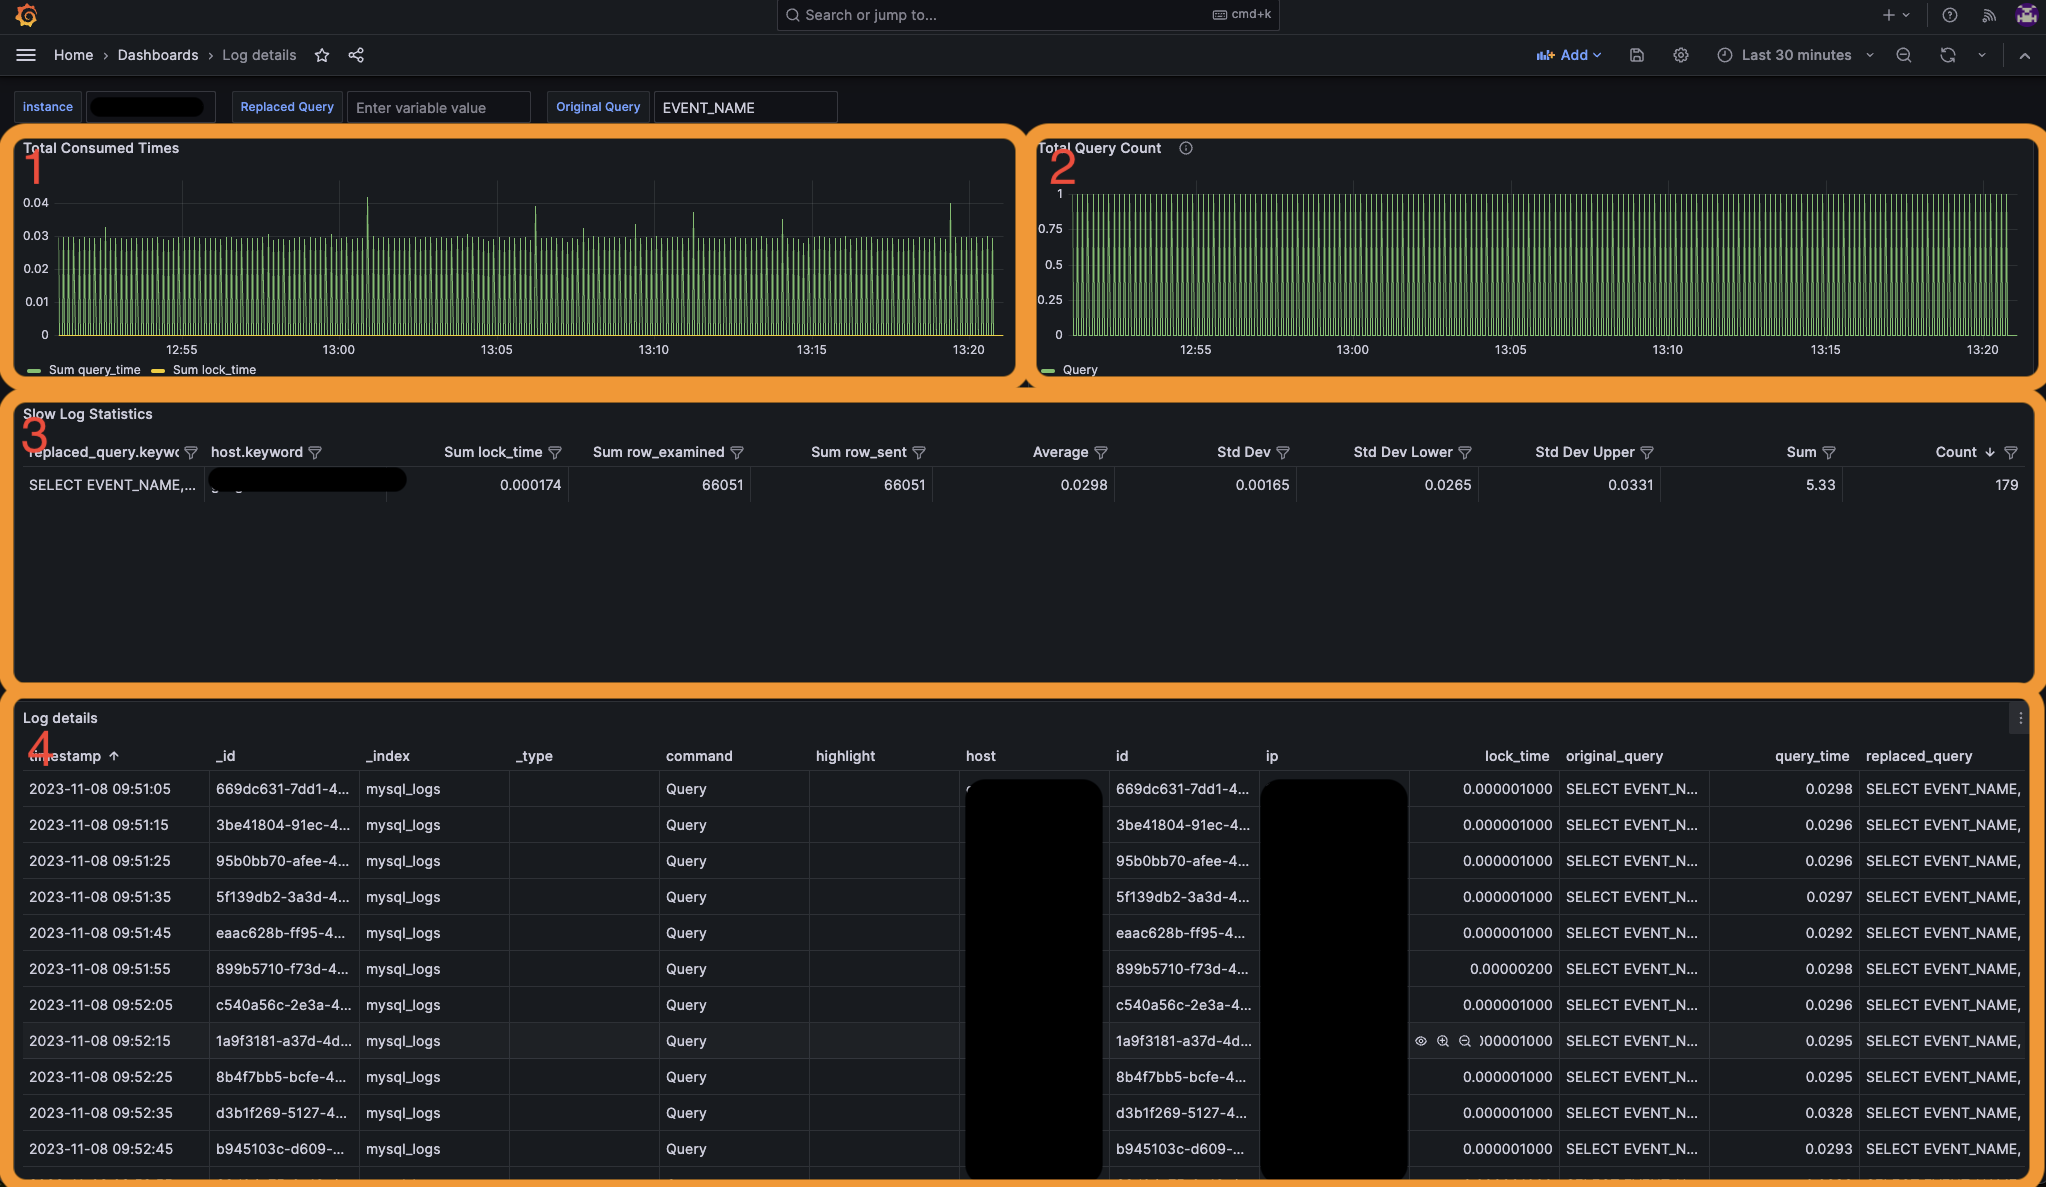
}Dashboard: resources/grafana/dashboard.yml
- That graph shows us total query time and total lock times.
- That graph shows us total query counts.
- That table gives us anonymized query statistics.(Sum, average, standard deviation vs)
- That table gives us detail of the queries.
View on the kibana dashboard or file
Checked with cargo-audit
Advisory database for rust: https://rustsec.org/advisories/


