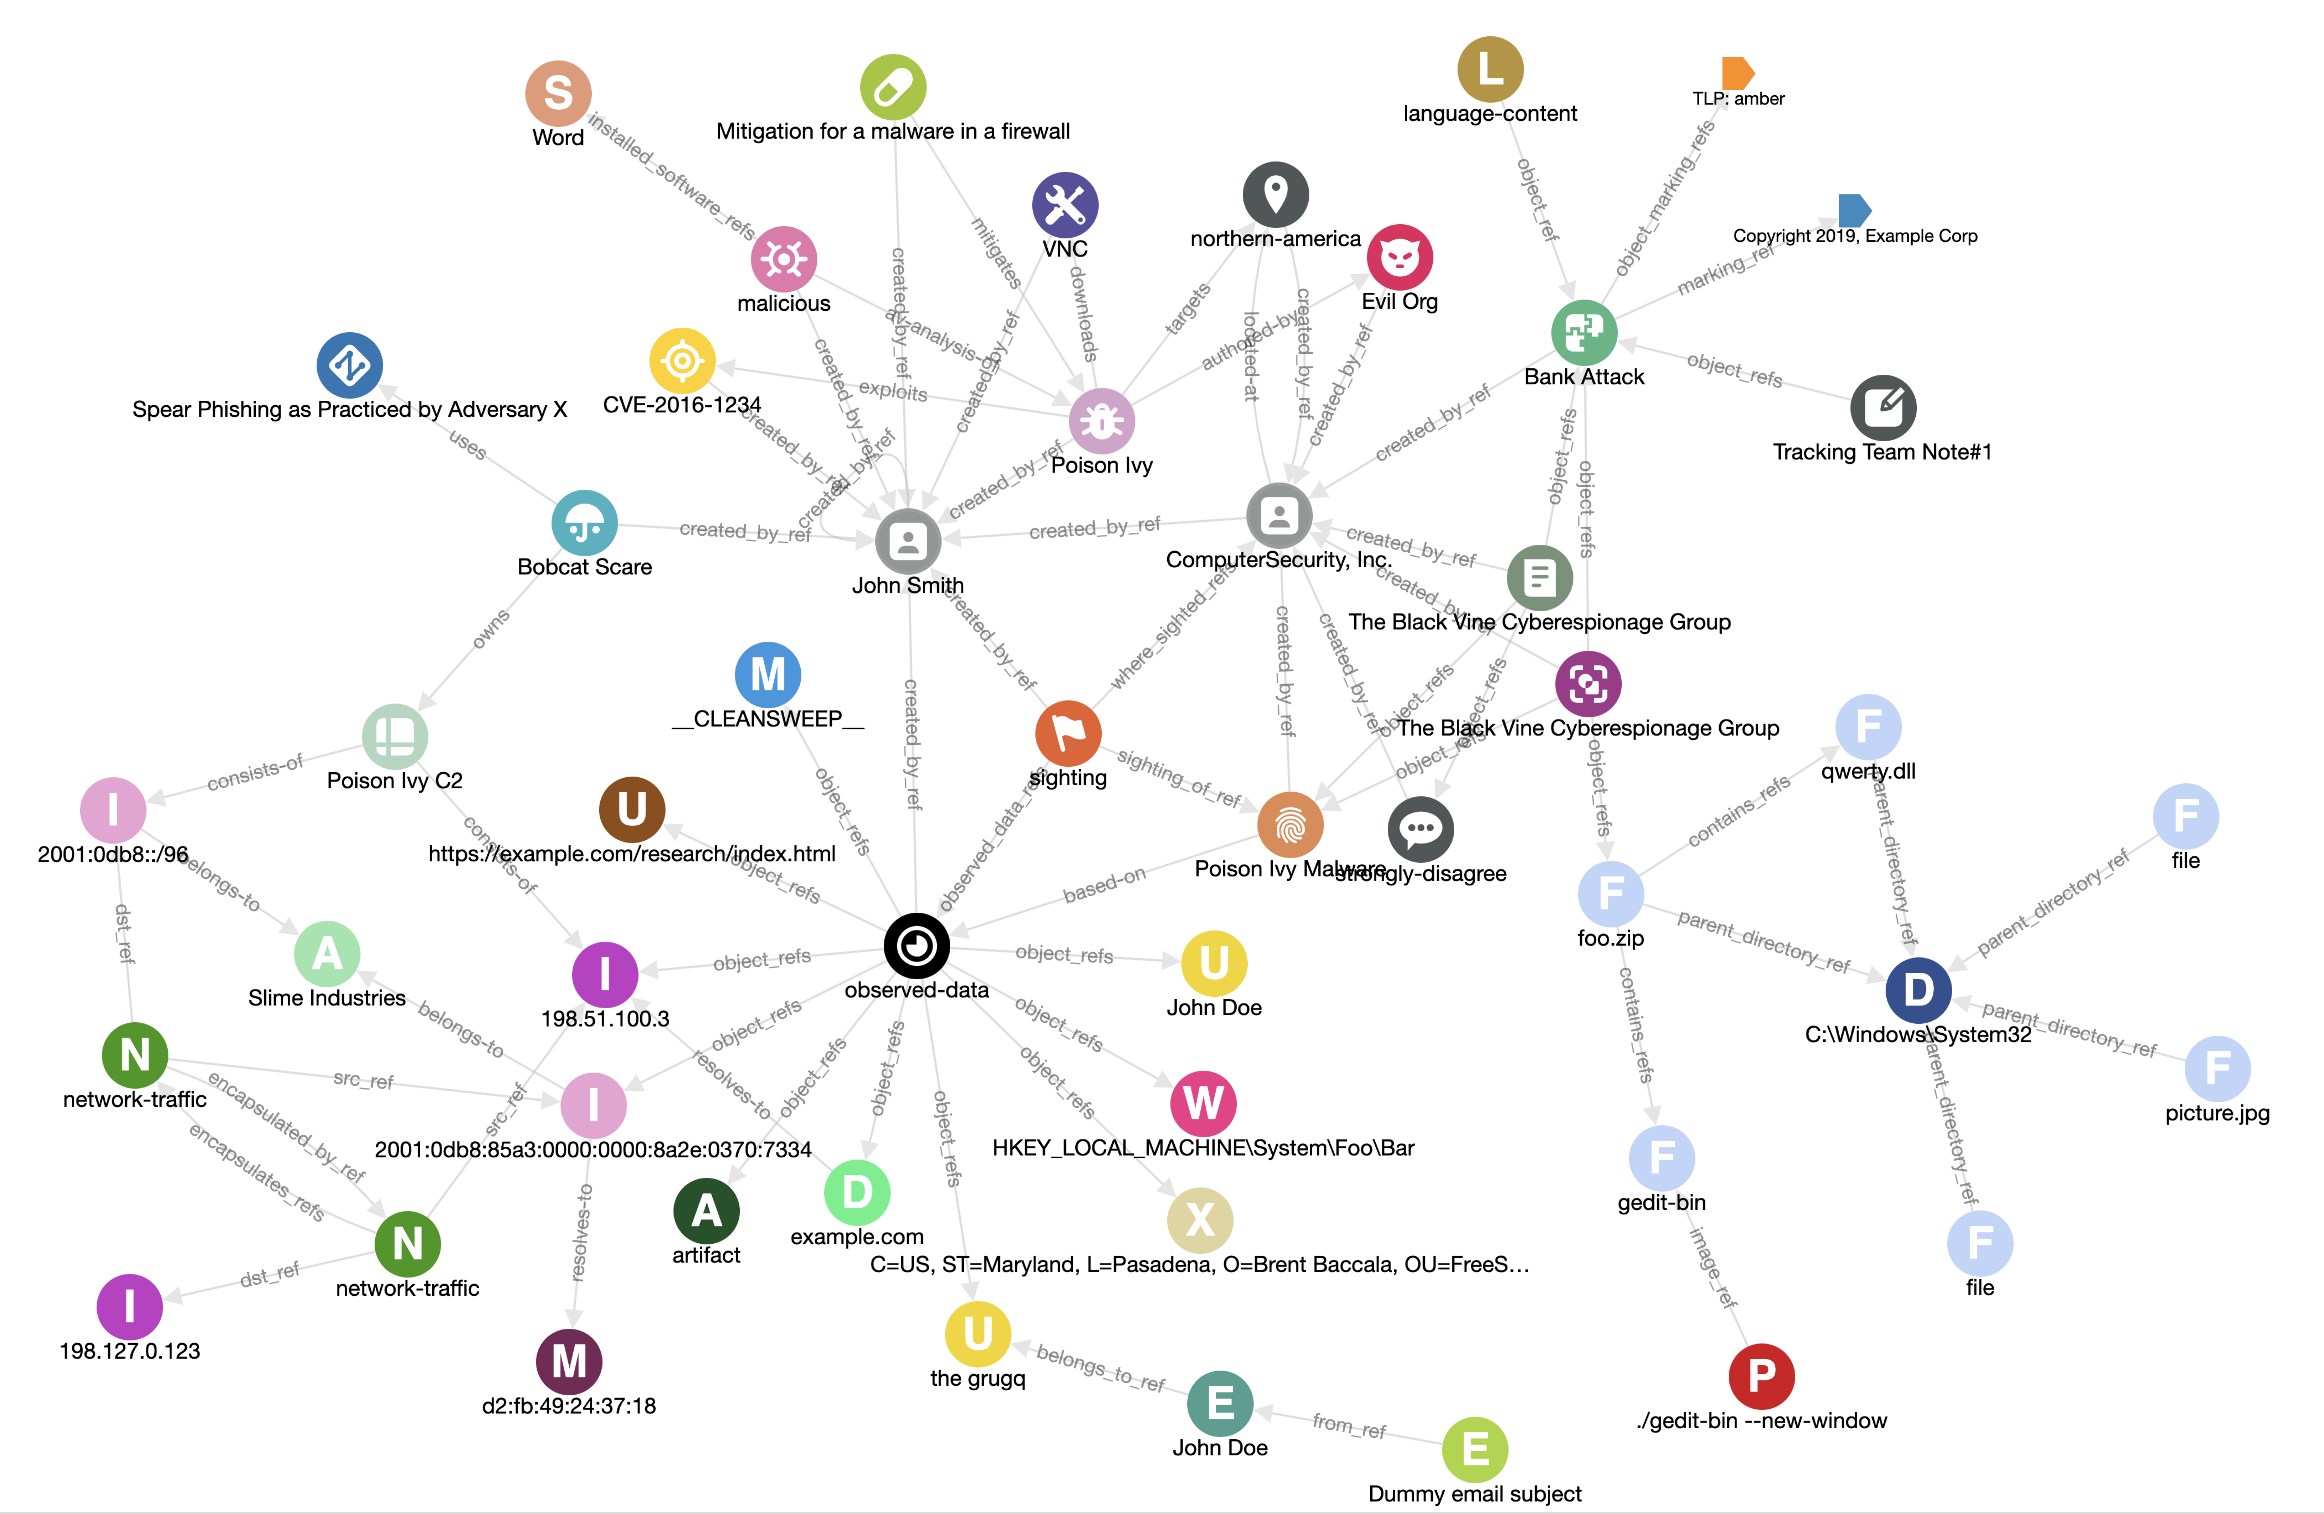
stixview is an embeddable STIX2 graph library.
In addition, jupyter-widget-stixview is a Jupyter notebook widget that uses stixview to render STIX2 graphs.
CTI (Cyber Threat Intelligence) is very much about telling stories. Information becomes intelligence when it is complimented with a context and is placed in a story. These stories are usually crystallised in the reports by an intelligence provider and disseminated to the customers.
If intelligence provider cares about structured machine-readable CTI, the reports produced will be supplemented with STIX2 bundles. There is a gap there between a story, narrated in a report, and a structured CTI snapshot, represented by a STIX2 bundle.
The objective of stixview library is to provide easily embeddable STIX2 graphs with necessary level of interactivity, so that CTI community can create informative and engaging stories.
To see stixview in action, take a look at these demo pages:
- Storyline — multiple graphs per page, rendering selected entities from the same STIX bundle.
- Viewer — graph viewer with custom controls.
- Drag-n-drop — graph views with drag-n-drop enabled.
- Dark theme graph from inline data — rendering graph from inline STIX2 bundle and custom styling.
- Examples of various configuration settings
To use stixview in a browser, download the latest build from dist directory (stixview.bundle.js) and reference it from your HTML file:
<script src="stixview.bundle.js" type="text/javascript"></script>or use unpkg CDN service:
<script src="https://unpkg.com/stixview/dist/stixview.bundle.js" type="text/javascript"></script>The library relies heavily on data attributes.
On page load, stixview will find all HTML elements with data-stix-gist-id, data-stix-url or data-stix-allow-dragdrop set and use these elements as graph holders.
Example of a graph holder div:
<div data-stix-gist-id="6a0fbb0f6e7faf063c748b23f9c7dc62"
     data-show-sidebar=true
     data-disable-mouse-zoom=true
     data-graph-width=500
     data-graph-height=300>
</div>Every holder element must have one of data-stix-gist-id, data-stix-url or data-stix-allow-dragdrop set, otherwise it will not be detected by the library.
stixview supports these data- attributes:
stix-gist-id — id of a gist that contains STIX2 bundle. if gist-file is not specified, first file will be used.
gist-file — name of a file from gist to be used as STIX2 bundle. Only used if stix-gist-id is set.
stix-url — URL pointing to a remote STIX2 bundle JSON file.
stix-allow-dragdrop (false by default) — enable ability to drag-n-drop STIX2 bundle into the graph element. If this property is set to true and stix-gist-id and stix-url are not specified, empty graph will be rendered.
caption — a title of the graph. Header is not shown if caption is not set.
hide-footer (false by default) — hide graph footer with a download link to STIX2 bundle.
show-sidebar (false by default) — enable a sidebar with object details, opened when object is clicked on.
show-idrefs (false by default) — show placeholder objects for ids mentioned in the relationships but not present in a bundle.
graph-layout (cola by default) — name of the graph layout algorythm. Supported algorythms are cola , klay, cose-bilkent, and dagre.
disable-mouse-zoom (false by default) — disable mouse wheel zoom.
disable-panning (false by default) — disable panning in the graph, making graph view fixed. Users will still be able to drag nodes around.
disable-labels (false by default) — disable node labels.
show-markings (false by default) — render marking-definition objects. These objects are usually heavily connected, so skipping them improves graph readability.
highlighted-objects — a string with comma-separated STIX2 ids. If set, graph will contain only objects with ids listed.
hidden-objects — a string with comma-separated STIX2 ids. If set, objects with ids listed will be skipped and not rendered in the graph.
min-zoom (0.3 by default) — minimum allowed zoom.
max-zoom (2.5 by default) — maximum allowed zoom.
graph-width (all available width by default) — width of a graph element. Both pixel and % values are supported (see misc demo page for an example).
graph-height (600 pixels by default) — height of a graph element. Both pixel and % values are supported (see misc demo page for an example).
The library, when used in a browser, will register stixview variable on window object with these properties:
registry — a registry of graphs initiated on a page.
onInit(selector, callback) – listener hook for graph's init event on a DOM element that matches provided selector value (see demo for usage example). Callback receive instance of a graph interface.
onLoad(selector, callback) – listener hook for graph's load event on a DOM element that matches provided selector value (see demo for usage example). Callback receive instance of a graph interface.
init(element, properties, initCallback, loadCallback) — method that initiates a graph view in specified element with provided properties that override defaults (see demo for usage example).
Graph is an object with properties:
cy – cytoscape.js graph object.
element — DOM element that holds a graph.
options – configured graph options.
runLayout(name) — run specific layout on a graph.
enableLabels() — enable labels in a graph.
disableLabels() — disable labels in a graph.
fit() — fit graph fully into a graph view.
showIdrefs(callback) — show idref placeholders on a graph. This will trigger layout recalculation. Callback is triggered when layout algorithm finishes.
hideIdrefs(callback) — hide idref placeholders on a graph. This will trigger layout recalculation. Callback is triggered when layout algorithm finishes.
loadData(data) — load STIX2 bundle from data JSON object and render on a graph.
loadDataFromFile(file) — load STIX2 bundle from file file object and render on a graph.
loadDataFromUrl(url) — load STIX2 bundle from remote URL and render on a graph.
loadDataFromParamUrl(paramName) — load STIX2 bundle from remote URL, configured in HTTP GET paramter with name in paramName and render on a graph.