tastypl is a Go program that imports your tastyworks transactions and figures out some statistics to help you track your performance and positions. The main motivation behind it was to track the net credit after rolls.
It has since evolved to provide a lot of accounting data that TastyWorks simply does not provide.
NOTE: This repository is a fork of the orginal at https://github.com/gotasty/tastypl which has not been maintained in a while.
Prerequisites: Git (https://git-scm.com/), Go (https://golang.org/)
- Clone the repository:
git clone https://github.com/elescondite/tastypl.git
- Install the dependencies:
go env -w GO111MODULE=off
go get github.com/Graeme22/go-chart
go get github.com/golang/glog
go get github.com/shopspring/decimal
- Run the code on your CSV file (instructions on how to obtain below.)
go run tastypl.go -input yourcsvfile.csv -printpl -positions -chart
Note: On MacOS, the full path to the CSV file must be specified.
go run tastypl -input inputfile [options]

Output Options
  -chart
    	create a chart of P&L
  -chartnocash
    	exclude cash from chart of P&L
  -cumulative
    	print cumulative statistics
  -daily
    	create a CSV of daily balances
  -daily-todate
    	include cumulative to-date columns in CSV (default true)
  -ignoreacat
    	ignore all ACAT transfers
  -input string
    	input csv file containing tastyworks transactions
  -nofutures
    	ignore all futures transactions
  -positions
    	print current positions
  -printpl
    	print realized P&L per underlying
  -stats
    	print overall statistics
  -ytd
    	limit output to YTD transactions

Logging Options
  -alsologtostderr
    	log to standard error as well as files
  -log_backtrace_at value
    	when logging hits line file:N, emit a stack trace
  -log_dir string
    	If non-empty, write log files in this directory
  -logtostderr
    	log to standard error instead of files
  -stderrthreshold value
    	logs at or above this threshold go to stderr
  -v value
    	log level for V logs
  -vmodule value
    	comma-separated list of pattern=N settings for file-filtered logging
On the tastyworks desktop app, go to the History tab, and under "transactions" pick a start date that is before the creation of your account, then click the CSV button to export all the transactions to a file. You need all the transactions in the CSV file otherwise the numbers won't make sense.
Here is a simple example for a portfolio with an AAPL straddle, a BIDU position that has received an assignment, and a ROKU position that has been rolled.
$ go run tastypl.go -input demo.csv -printpl -positions
----- Overall statistics ----
Number of transactions:    46    (in 97 days => 0.5/day avg)
Realized P&L:            2246.00
Commissions:              -37.00 (-1.65% of P&L)
Fees:                     -19.11 (-0.85% of P&L)
Interest:                 -72.43 (-3.22% of P&L)
Gross P&L:               2117.46 (~21.83/day avg, 94.28% of P&L)
Equity:                 -25000.00 (1 positions)
Adjusted Gross P&L:     -22882.54
Net money movements:    31000.00
Outstanding premium:     5673.00
Cash on hand:           14024.46
---- Realized P&L detail ----
/NQH8    80.00
BIDU   1148.00
PCLN    896.00
ROKU    122.00
----- Current portfolio -----
AAPL  (2 positions)
  Feb 16 short 1 $170 call @ 7.2 [BEP=177.20]
  Feb 16 short 1 $170 put  @ 5.35 [BEP=164.65]
  --> 170 straddle @ 12.55 net credit
BIDU  (3 positions) [RPL=1148.00]
  long  100 shares @ 250.00 (adj. cost basis 247.66)
  Feb 16 short 1 $217.5 call @ 7.4 [BEP=224.90]
  Mar 16 short 1 $250 put  @ 32 [BEP=218.00]
ROKU  (1 position) [RPL=122.00]
  Feb 16 short 1 $44 put  @ 4.78 [BEP=38.00]  (net credit 6.00)
The -chart option will generate a graph in rpl.png that looks like this:
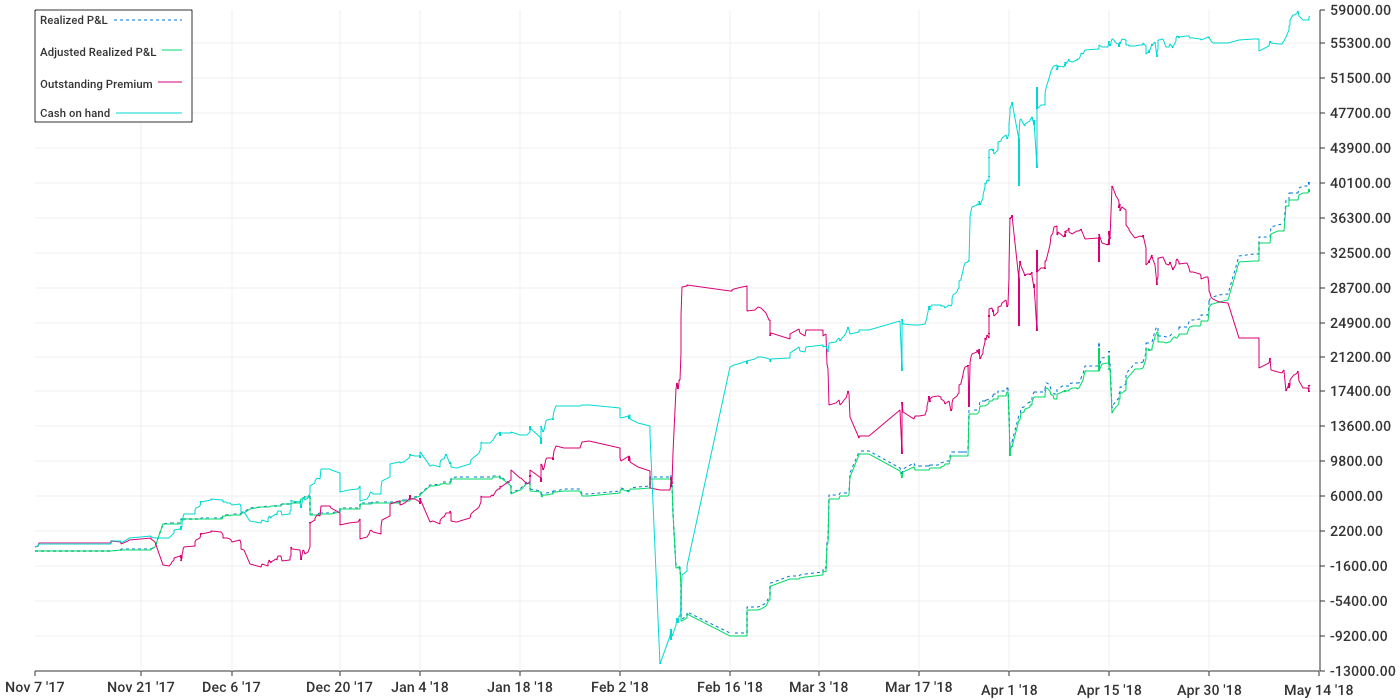
On the chart, "adjusted realized P/L" is the realized P/L net of commissions, fees, interest paid if any, etc. Outstanding premium is the amount of premium sold (if positive, bought if negative) at the price it was opened – the script does not track the mark of positions over time, only opening/closing prices, as it does not have access to any historical market data. Cash on hand should match what is shown in tastyworks' account balance.
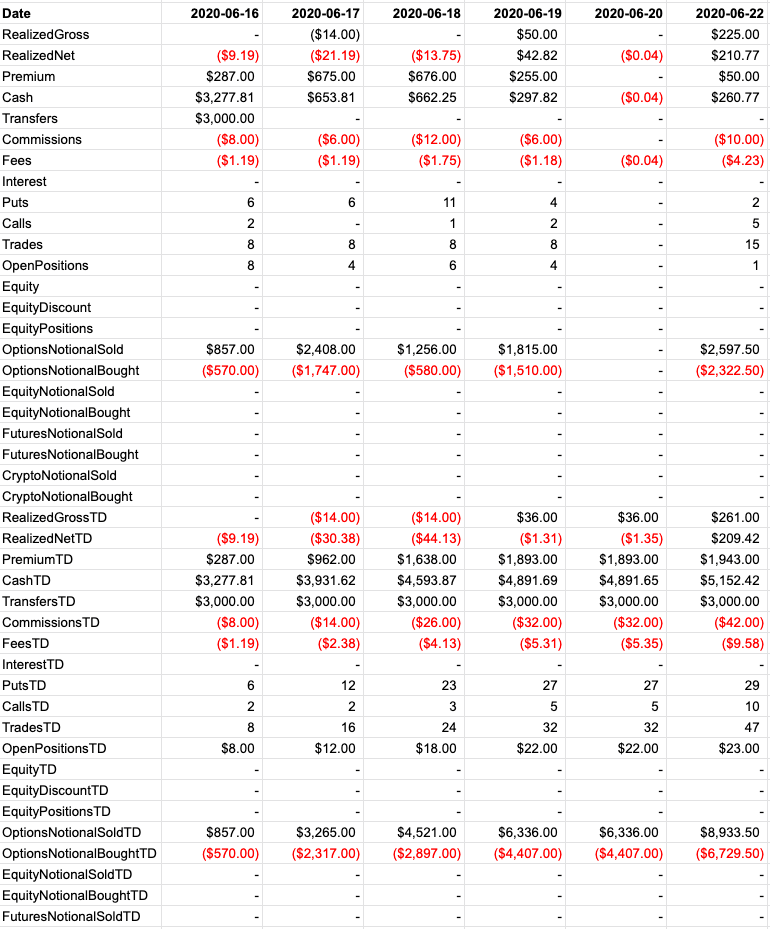
The -daily option will generate a CSV output with daily balances (something tastyworks is lacking). You should run tastypl with the -daily option by itself and redirect to a file to get a CSV file.
The following fictional sample has had the rows and columns transposed to make it easier to the see the (almost 4 dozen!) output fields.
tastyworks and tastytrade are not affiliated with the makers of this program and do not endorse this product. This program does not provide investment, tax, or legal advice. Options involve risk and are not suitable for all investors as the special risks inherent to options trading may expose investors to potentially significant losses. Futures and futures options trading is speculative and is not suitable for all investors.
THERE IS NO WARRANTY FOR THE PROGRAM, TO THE EXTENT PERMITTED BY APPLICABLE LAW. EXCEPT WHEN OTHERWISE STATED IN WRITING THE COPYRIGHT HOLDERS AND/OR OTHER PARTIES PROVIDE THE PROGRAM “AS IS” WITHOUT WARRANTY OF ANY KIND, EITHER EXPRESSED OR IMPLIED, INCLUDING, BUT NOT LIMITED TO, THE IMPLIED WARRANTIES OF MERCHANTABILITY AND FITNESS FOR A PARTICULAR PURPOSE. THE ENTIRE RISK AS TO THE QUALITY AND PERFORMANCE OF THE PROGRAM IS WITH YOU. SHOULD THE PROGRAM PROVE DEFECTIVE, YOU ASSUME THE COST OF ALL NECESSARY SERVICING, REPAIR OR CORRECTION.