by Ess Jaraha
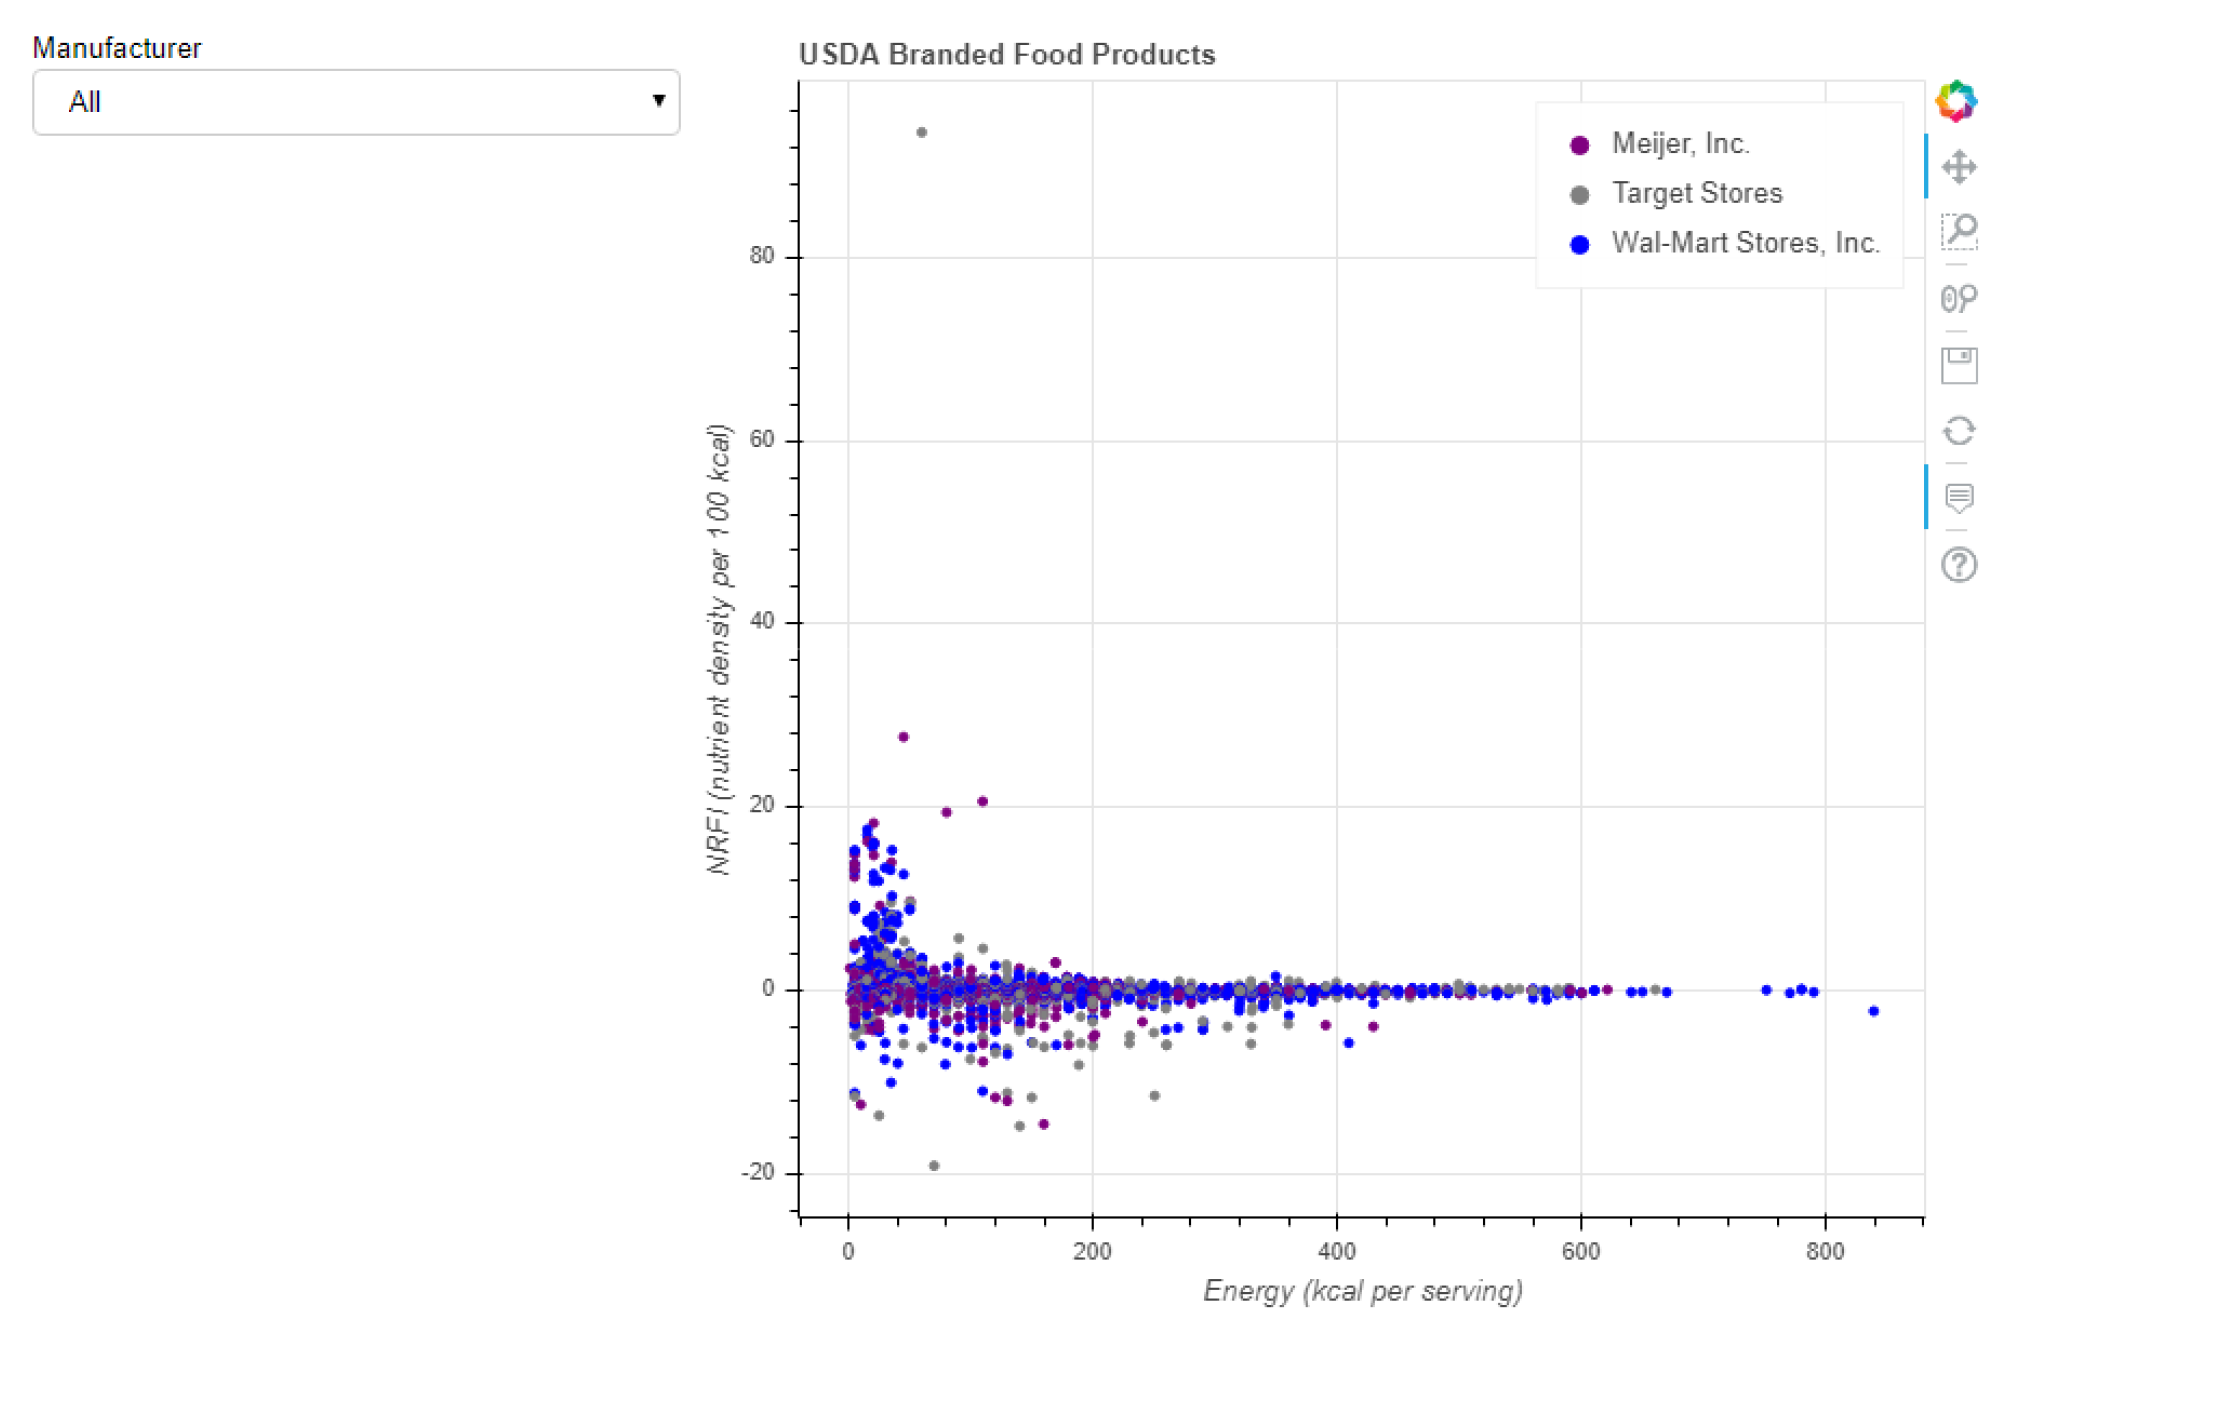
With this tutorial, you can create an interactive visualization using data from the USDA Branded Food Products Database. Food products from three manufacturers are plotted on a scatter plot according to their nutrient rich foods index (NFRI) and energy content per serving size. A CategoricalColorMapper is used to color points by manufacturer. A HoverTool shows additional product information. A Select widget allows the user to control the data displayed on the plot. Bokeh Server is used to output the visualization.
Input: data from USDA Branded Food Product Database, with calculated NFRI
- three manufacturers: Wal-Mart, Meijer, Inc., and Target
Output: interactive visualization using Bokeh Server
-
Open viz.py
notice that most of the script is commented out we will be uncommenting as we move through the tutorial
-
Run viz.py
from bokeh.plotting import figure, ColumnDataSource, curdoc, Row, show, output_file
from bokeh.models import HoverTool, CategoricalColorMapper, Select
import pandas as pd
import os

# change cwd to the location of this script
dir_script =  os.path.dirname(os.path.abspath("__file__"))
os.chdir(dir_script)

# initialize figure
viz = figure(x_axis_label = "Energy (kcal per serving)"\
             ,y_axis_label = "NRFI (nutrient density per 100 kcal)"\
             ,title="USDA Branded Food Products")

# import data
path = os.path.join(dir_script,"data.csv")
df = pd.read_csv(path, dtype=object)

# convert data types
float_cols = ["nrfi","serving_size", "household_serving_size", "energy_per_serving"]
df[float_cols] = df[float_cols].astype("float32")

# generate html file
output_file("output_file.html")

# show visualization in browser
show(viz)
- Notice the html file called output_file.html in the Bokeh_Tutorial folder
- what's happening??
-
import packages
-
set current working directory
-
figure()
- initializes the plot
- assigned to variable "viz"
- parameters x axis label, y axis label, and title set the axis labels and title of the figure
- initializes the plot
-
pd.read_csv()
- imports data as a dataframe
- assigned to variable "df"
- imports data as a dataframe
-
convert data types
-
output_file()
- outputs an html file of the figure in the Bokeh_Tutorial folder
- called "output_file.html"
- outputs an html file of the figure in the Bokeh_Tutorial folder
-
show()
- opens a browser to display the figure
-
Output of show():

Output of output_file():
.PNG)
- Set Data Source
- in viz.py, uncomment the code shown below
- run viz.py
# set data source
data_source = ColumnDataSource(df)-
what's happening??
-
ColumnDataSource()
-
assigned to variable "data_source"
-
initializes data source
-
does not change the appearance of the figure
-
-
- Add glyph
- in viz.py, uncomment the code shown below
- run viz.py
# color by manufacturer
mapper = CategoricalColorMapper(factors = ["Wal-Mart Stores, Inc.","Meijer, Inc."\
                                           ,"Target Stores"]\
                                ,palette=["blue","purple","gray"])

# add glyph
viz.circle("energy_per_serving","nrfi", source=data_source,\
legend="manufacturer", color=dict(field='manufacturer',transform=mapper))-
what's happening??
-
viz.circle()
- adds circle glyph to the figure (viz)
- parameters 1 & 2
- fields from df to be used for x and y axes
- source parameter
- specifies the data for the glyph (defined in step 4)
- multiple glyphs can be added to a plot with different data sources
- legend parameter
- specifies field to be used in the legend
- color parameter
- defines the color of the glyph
- syntax: dict(field='field-to-be-color-mapped', transform=how-to-map-field)
- parameters 1 & 2
- adds circle glyph to the figure (viz)
-
CategoricalColorMapper()
-
assigned to variable "mapper"
-
factor parameter
- values to be color-mapped
- must be values in the field of viz.circle() 's color parameter
-
palette parameter
-
defines colors for factors
-
order matters
-
-
-
- Define and Add HoverTool
- in viz.py, uncomment the code shown below
- run viz.py
- notice a new tool in the sidebar
- hover over a glyph
# define hover tool
hover = HoverTool(tooltips=[("long_name","@long_name")\
                            ,("manufacturer","@manufacturer")\
                            ,("nrfi", "@nrfi")\
                            ,("energy per serving","@energy_per_serving kcal")\
                            ,("serving size","@household_serving_size @household_serving_size_uom")])

# add hover tool
viz.add_tools(hover)- what's happening??
- HoverTool()
- defines HoverTool
- tooltips parameter
- specifies labels and data for HoverTool
- syntax: tooltips = [("label-to-be-displayed", "@field-name-for-data-to-be-displayed optional-additional-text")]
- @ symbol means show data from field
- $ symbol can be used to show data from cursor position ($x or $y)
- syntax: tooltips = [("label-to-be-displayed", "@field-name-for-data-to-be-displayed optional-additional-text")]
- specifies labels and data for HoverTool
- tooltips parameter
- defines HoverTool
- viz.add_tools(hover)
- adds HoverTool to visualization
- without this step, the hover tool would be defined, but would not appear on the visualization
- HoverTool()
.PNG)
- Define Select Widget and Layout
- in viz.py, uncomment the code shown below
- !! at the bottom of viz.py, change show(viz) to show(layout)
- run viz.py
- change the selection in the select tool
# define Select widget
manufacturers = list(pd.unique(df.manufacturer))
manufacturers.append("All")
select_widget = Select(title="Manufacturer", options=manufacturers, value="All")

# define layout
layout = Row(select_widget,viz)-
what's happening??
-
manufacturers
- list(pd.unique(df.manufacturer))
- create a list of unique values in the manufacturer column in the df dataframe
- these will be the options for the Select widget
- manufacturers.append("All")
- add the string "All" to the list of unique manufacturers
- this option will display data from all three manufacturers
- list(pd.unique(df.manufacturer))
-
select_widget = Select(title="Manufacturer", options=manufacturers, value="All")
- assigned to variable "select_widget"
- defines the Select widget
- syntax: Select(title="title-for-select-tool", options=select-tool-options, value="default-option-for-select-tool")
-
Row()
-
assigned to the variable "layout"
-
defines layout of application (widgets and figures should go)
- select_widget will be on the left
- the figure (viz) will be on the right
-
can use **Column() ** instead to arrange objects vertically
-
-

- Define the Callback
- in viz.py, uncomment the code shown below
- run viz.py
- change the selection in the select tool
# define callback for select_widget
def update():
    if select_widget.value != "All":
        df_select = df[df.manufacturer == select_widget.value]
        source.data.update(df_select)
    else:
        source.data.update(df)

# call update() function when select_widget value changes
select_widget.on_change('value', lambda attr,old,new : update())

# update layout
curdoc().add_root(layout-
what's happening??
-
def update()
- defines the function that is called when a user changes the selection in the select tool
- if the value attribute of select_widget is not equal to "All" (in other words, if only data from a specific manufacturer should be displayed) then...
- df.manufacturer == select_widget.value
- create a boolean series that is True when the manufacturer field of df is equal to the value of select_widget
- df_select = df[df.manufacturer == select_widget.value]
- use the boolean series to to index df
- save the indexed dataframe as "df_select"
- df_select contains only the rows from df where the manufacturer matches the value of select_widget
- source.data.update(df_select)
- update the data attribute of source
- df.manufacturer == select_widget.value
- else
- source.data.update(df)
- update the data attribute of source
- source.data.update(df)
- if the value attribute of select_widget is not equal to "All" (in other words, if only data from a specific manufacturer should be displayed) then...
- defines the function that is called when a user changes the selection in the select tool
-
select_widget.on_change('value', lambda attr,old,new : update())
- this line of code makes the visualization interactive!! without it, the data would not update
- .on_change() method specifies what should happen when the value attribute of select_widget changes
- first parameter ('value')
- the attribute of select_widget which will be changing
- second parameter (lambda attr,old,new : update())
- what should happen when the value attribute of select_widget changes
- lambda function with three parameters (attr, old, new) which calls the update() function
- what should happen when the value attribute of select_widget changes
- first parameter ('value')
-
curdoc().add_root(layout)
- updates the current document to match the new layout (with changes from select_widget)
-
- Connect to Bokeh Server
- save viz.py
- open the Anaconda Prompt
- navigate to the Bokeh_Tutorial directory (where the script is stored)
- run the line of code shown below
- change the selection in the select tool
bokeh serve --show viz.py
The data in this tutorial comes from the USDA Branded Food Products Database.
- read more about USDA BFPD:
The nutrient rich foods index (NRFI) was calculated for each food product in the BFPD.
- read more about NRFI:
- NIH data used to calculate NRFI:
- Key concepts: https://bokeh.pydata.org/en/latest/docs/user_guide/concepts.html
- More on Bokeh server: https://bokeh.pydata.org/en/latest/docs/user_guide/server.html
- Bokeh application gallery: https://bokeh.pydata.org/en/latest/docs/gallery.html