This is an implementation of n-step SARSA and a gridworld to be solved by it.
It was created for the course Deep reinforcement learning (at UOS)
Author: Eosandra Grund
Date last modified: 20.07.2022
Sample execution code in Main_SARSA.py, execute in shell.
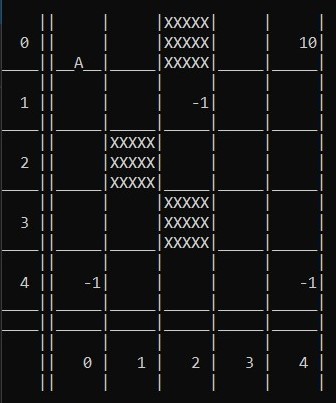
A = Agent
X = barrier
number = reward at the field
The class Gridworld is implemented in the File Grid.py. The constructor gets a dictionary with the layout.
Structure of the dictionary:
- x_dim (int>0) : x dimension of gridworld
- y_dim (int>0) : y dimension of gridworld
- epsilon (0<float<1) : for epsilon-greedy state transition function
- start [x,y] : starting state of agent for each episode
- terminal [x,y] : terminal state with a positive reward
- neg_rewards [[x,y,reward],[x,y,reward],...] : list of fields with negative rewards
- barrier [[x,y],[x,y],...] : list of fields that are barriers
There are some hardcoded gridworld dictionaries in the Gridworlds.py file(access via class variable Gridworlds.GRIDWORLD[index]), but you can also create your own ones.
A Gridworld has a starting state, a terminal state (with a positive reward of 10), some other negative rewards and barriers.
Possible actions are up, down, left and right.
State transition function: In the environment you take the given action with the probabiliy 1-epsilon and a random action with probability epsilon.
Reward function:
- 10 for the terminal state
- other rewards as user inputs
- -0.5 for invalid moves (against barriers or outside of the gridworld)
- -0.1 for every move (if no other reward)
The gridworld will be visualized via stdout, and because old prints have to be removed so the gridworld stays in the same place, it is best to execute everything in a shell.
The agent is in the SARSAn.py file. It is an implementation of the reinforcement-learning algorithm n-step SARSA and can also do 1-step SARSA and Monte Carlo.
It uses an epsilon-greedy policy with the possibility of decreasing the exploration over time (set decreasing_epsilon = True).
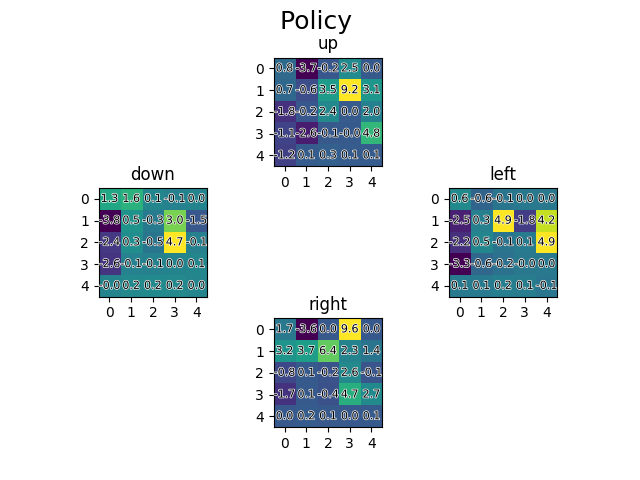
If you set visualize_policy = True, the q-values will be visualized after each episode as a matplotlib heatmap showing all state-action values.
Start the learning process with the start method. As parameters it gets the amount of episodes you want to do and if you want an evaluation.

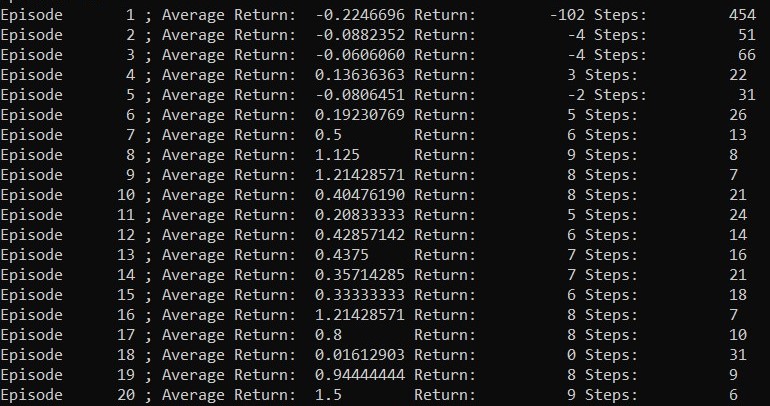
list of the average return, total return and steps per episode

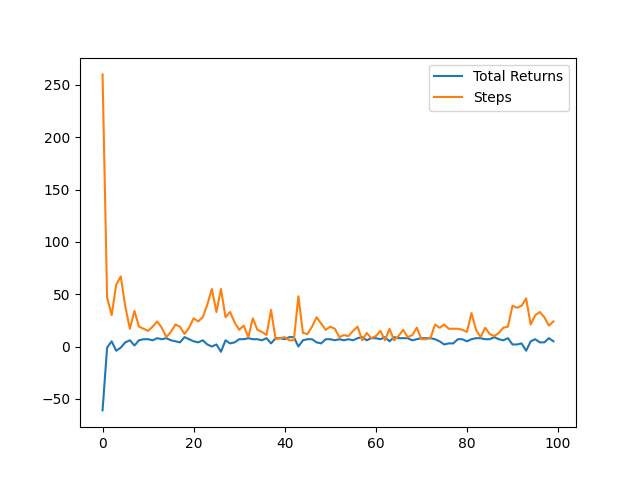
plot of the total return and steps per episode (The plot does only work if visualize_policy = False)
First you have to clone the repository.
You can use or modify Main_SARSA.py and execute it in the terminal.
Imports:
import matplotlib.pyplot as plt
import numpy as np
import SARSAn
import Grid
import Gridworlds
Creation of the Gridworld:
which_gridworld = 0
world = Grid.Gridworld(Gridworlds.Gridworlds.GRIDWORLD[which_gridworld])
world.visualize()
Decide which default world by changing which_gridworld to any value between 0 and 4. The gridworld on the picture above is gridworld 0.
Creation of player and learning start:
player = SARSAn.SARSAn(
	gridworld=world,
	n=10, epsilon=0.5,
	decreasing_epsilon = True,
	gamma = 0.99,
	alpha = 0.3,
	visualize_policy = False,
	visualize_grid = True)
player.start(episodes = 50, evaluation = True)
That means it is an 10-step SARSA solving Gridworld 0. You can change all of the parameters and see what happens. But changing them can cause the algorithm to be inefficient or not learning.
Create an MonteCarlo approach by executing this instead of the last cell.
player = SARSAn.SARSAn(gridworld=world,n = np.inf, epsilon= 0.3,alpha = 1)
player.start(episodes = 50, evaluation = True)
You can export your pyplot plots by executing the following lines after the learning is done (Only the plots you will see during learning will be in the picture).
plt.savefig("Figure_SARSA_policy_returns.png")
