grIDS
this is a fork from gradiuscypher/grIDS.
the main changes from the original project, is a docker-compose file to run all in one command, a setup Bash script that will update suricata.yaml files based on .env values. I added supervisor in suricata to start suricata service. Filebeat is now a container from elastic.co using docker labels to set up. The elk stack is on its own network (elk), only suricata container is on host's network + special cap_admin.
- prepare interface & files:
setupConf.sh
- build images:
docker-compose build
- start suricata & kibana:
docker-compose up -d suricata kibana
- wait for both to become green (see logs):
docker-compose logs -f
- eventueally imports dashboards, create indexes, process logs:
docker-compose up -d filebeat
- navigate to http://0.0.0.0:5601
My network monitoring solution and tools that go along with it. This setup is designed to be contained in an all-in-one sort of system, but services can be separated into individual hosts if you have a higher load that requires more resources.
The goal for this project is to help people combine multiple open-source tools to have a useful network monitoring solution. Within this project, I'll also include custom scripts that help make this system even more useful.
Feedback, corrections, and suggestions are welcomed and appreciated. Reach out to me on Twitter or here on Github as an Issue.
Manual Configuration Steps
To get started with configuring the system, follow the steps found in the Wiki. Each of the Configuration sections walks you through the parts of building a working all-in-one IDS system.
Docker Configuration Steps
To deploy the NSM via Docker containers, follow the instructions found under the Docker Configuration section of the Wiki.
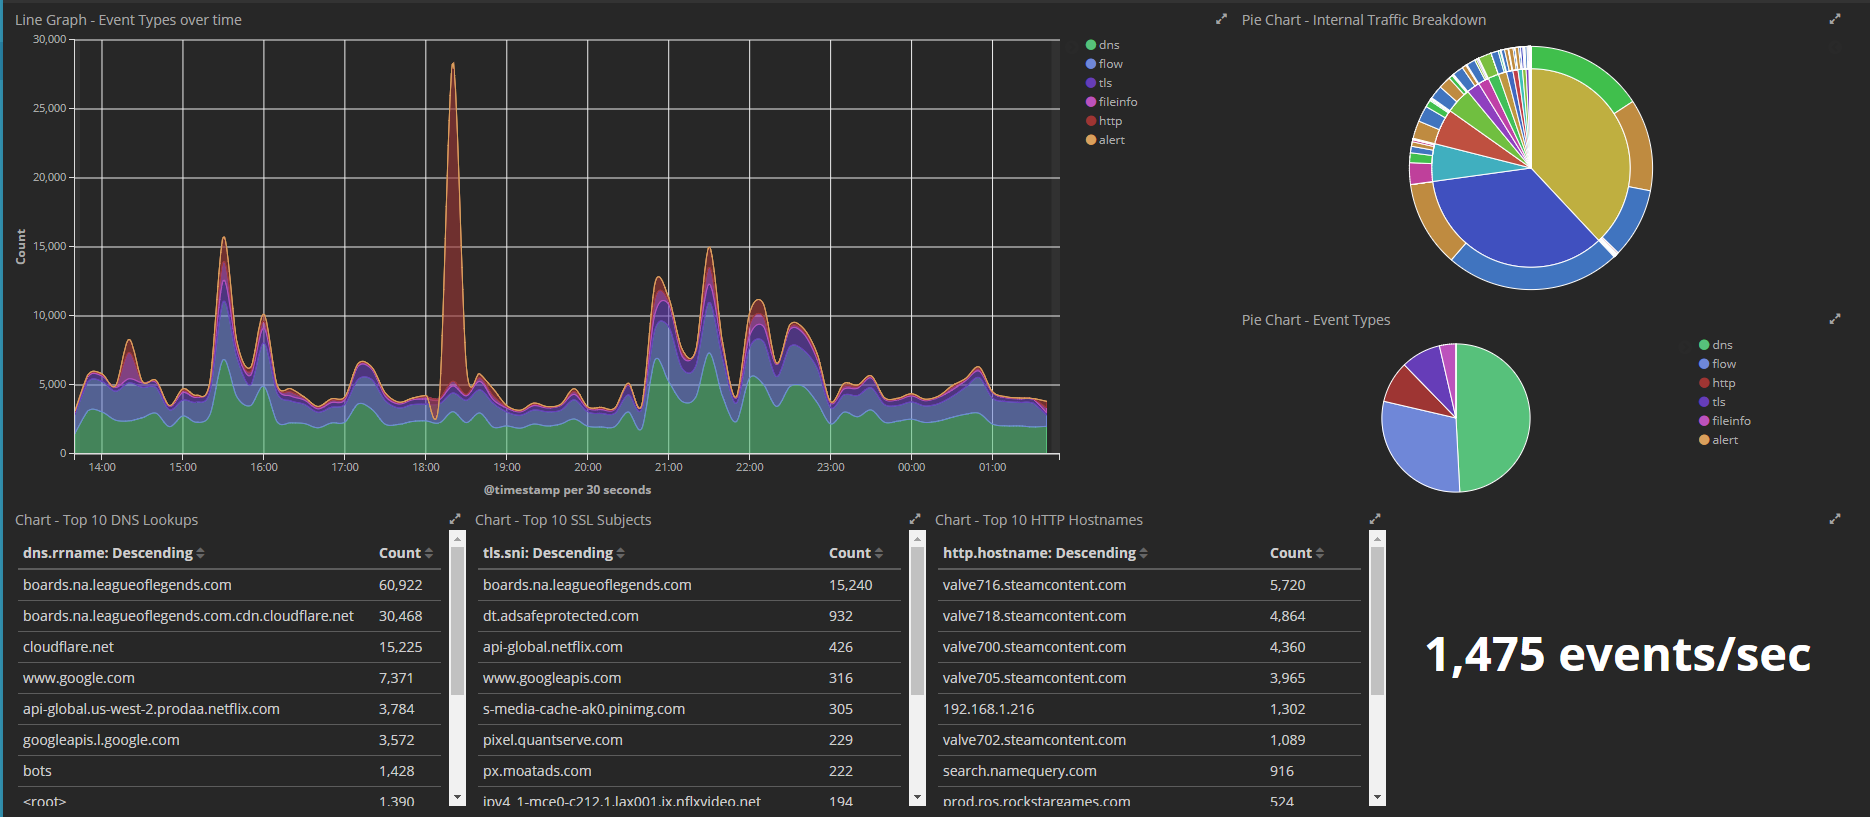
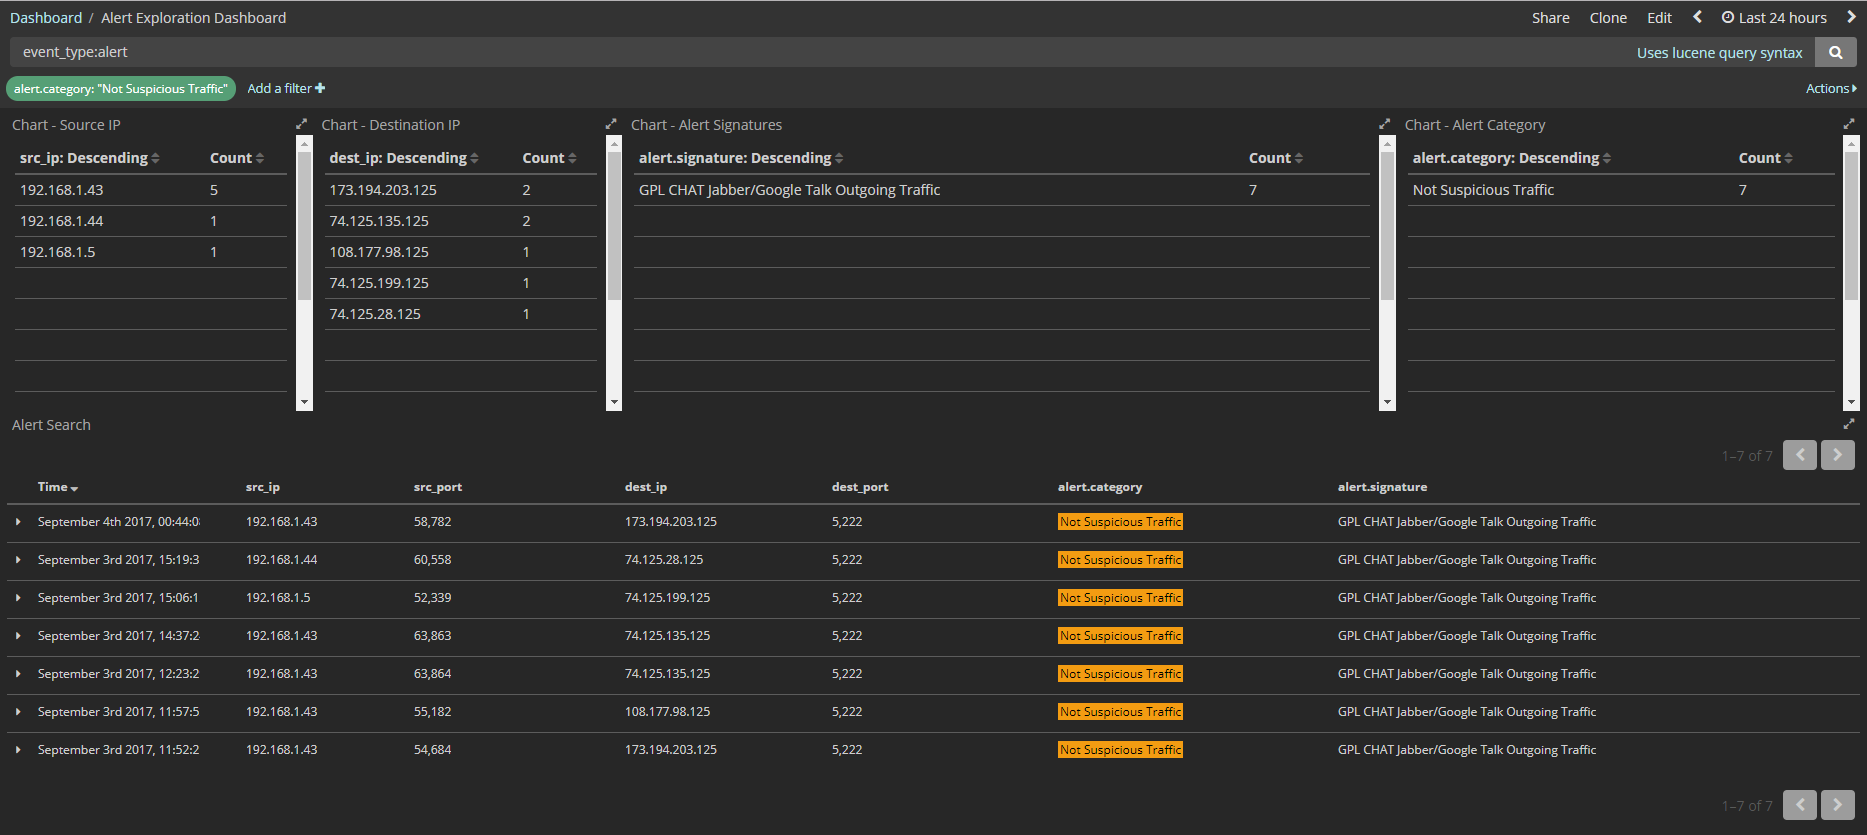
Screenshots
Screenshots of some Kibana Dashboards that have been created and powered using this setup
Future Additions + Modifications + Ideas
This is a list of future tools that could be added to this toolset for even more features. Also includes modifications.
Features
- Sysmon logging
- Bro logging
- Centralized Logging
- Webhook integration for alerts
- FPC and usability tools
- Pi-Hole DNS service
- Include EveBox for alerting
- Include Scirius rule management.
Modifications
- Performance tuning for Elastic Stack
- Performance tuning of Suricata - spread load between CPU threads
Ideas
- IDS Sensor on a Raspberry Pi
- Spreading services out among hosts, multiple sensor configuration and management
- Setting up an iptables sensor
- Setting up a hardware network tap
- Process for upgrading/updating the OS

