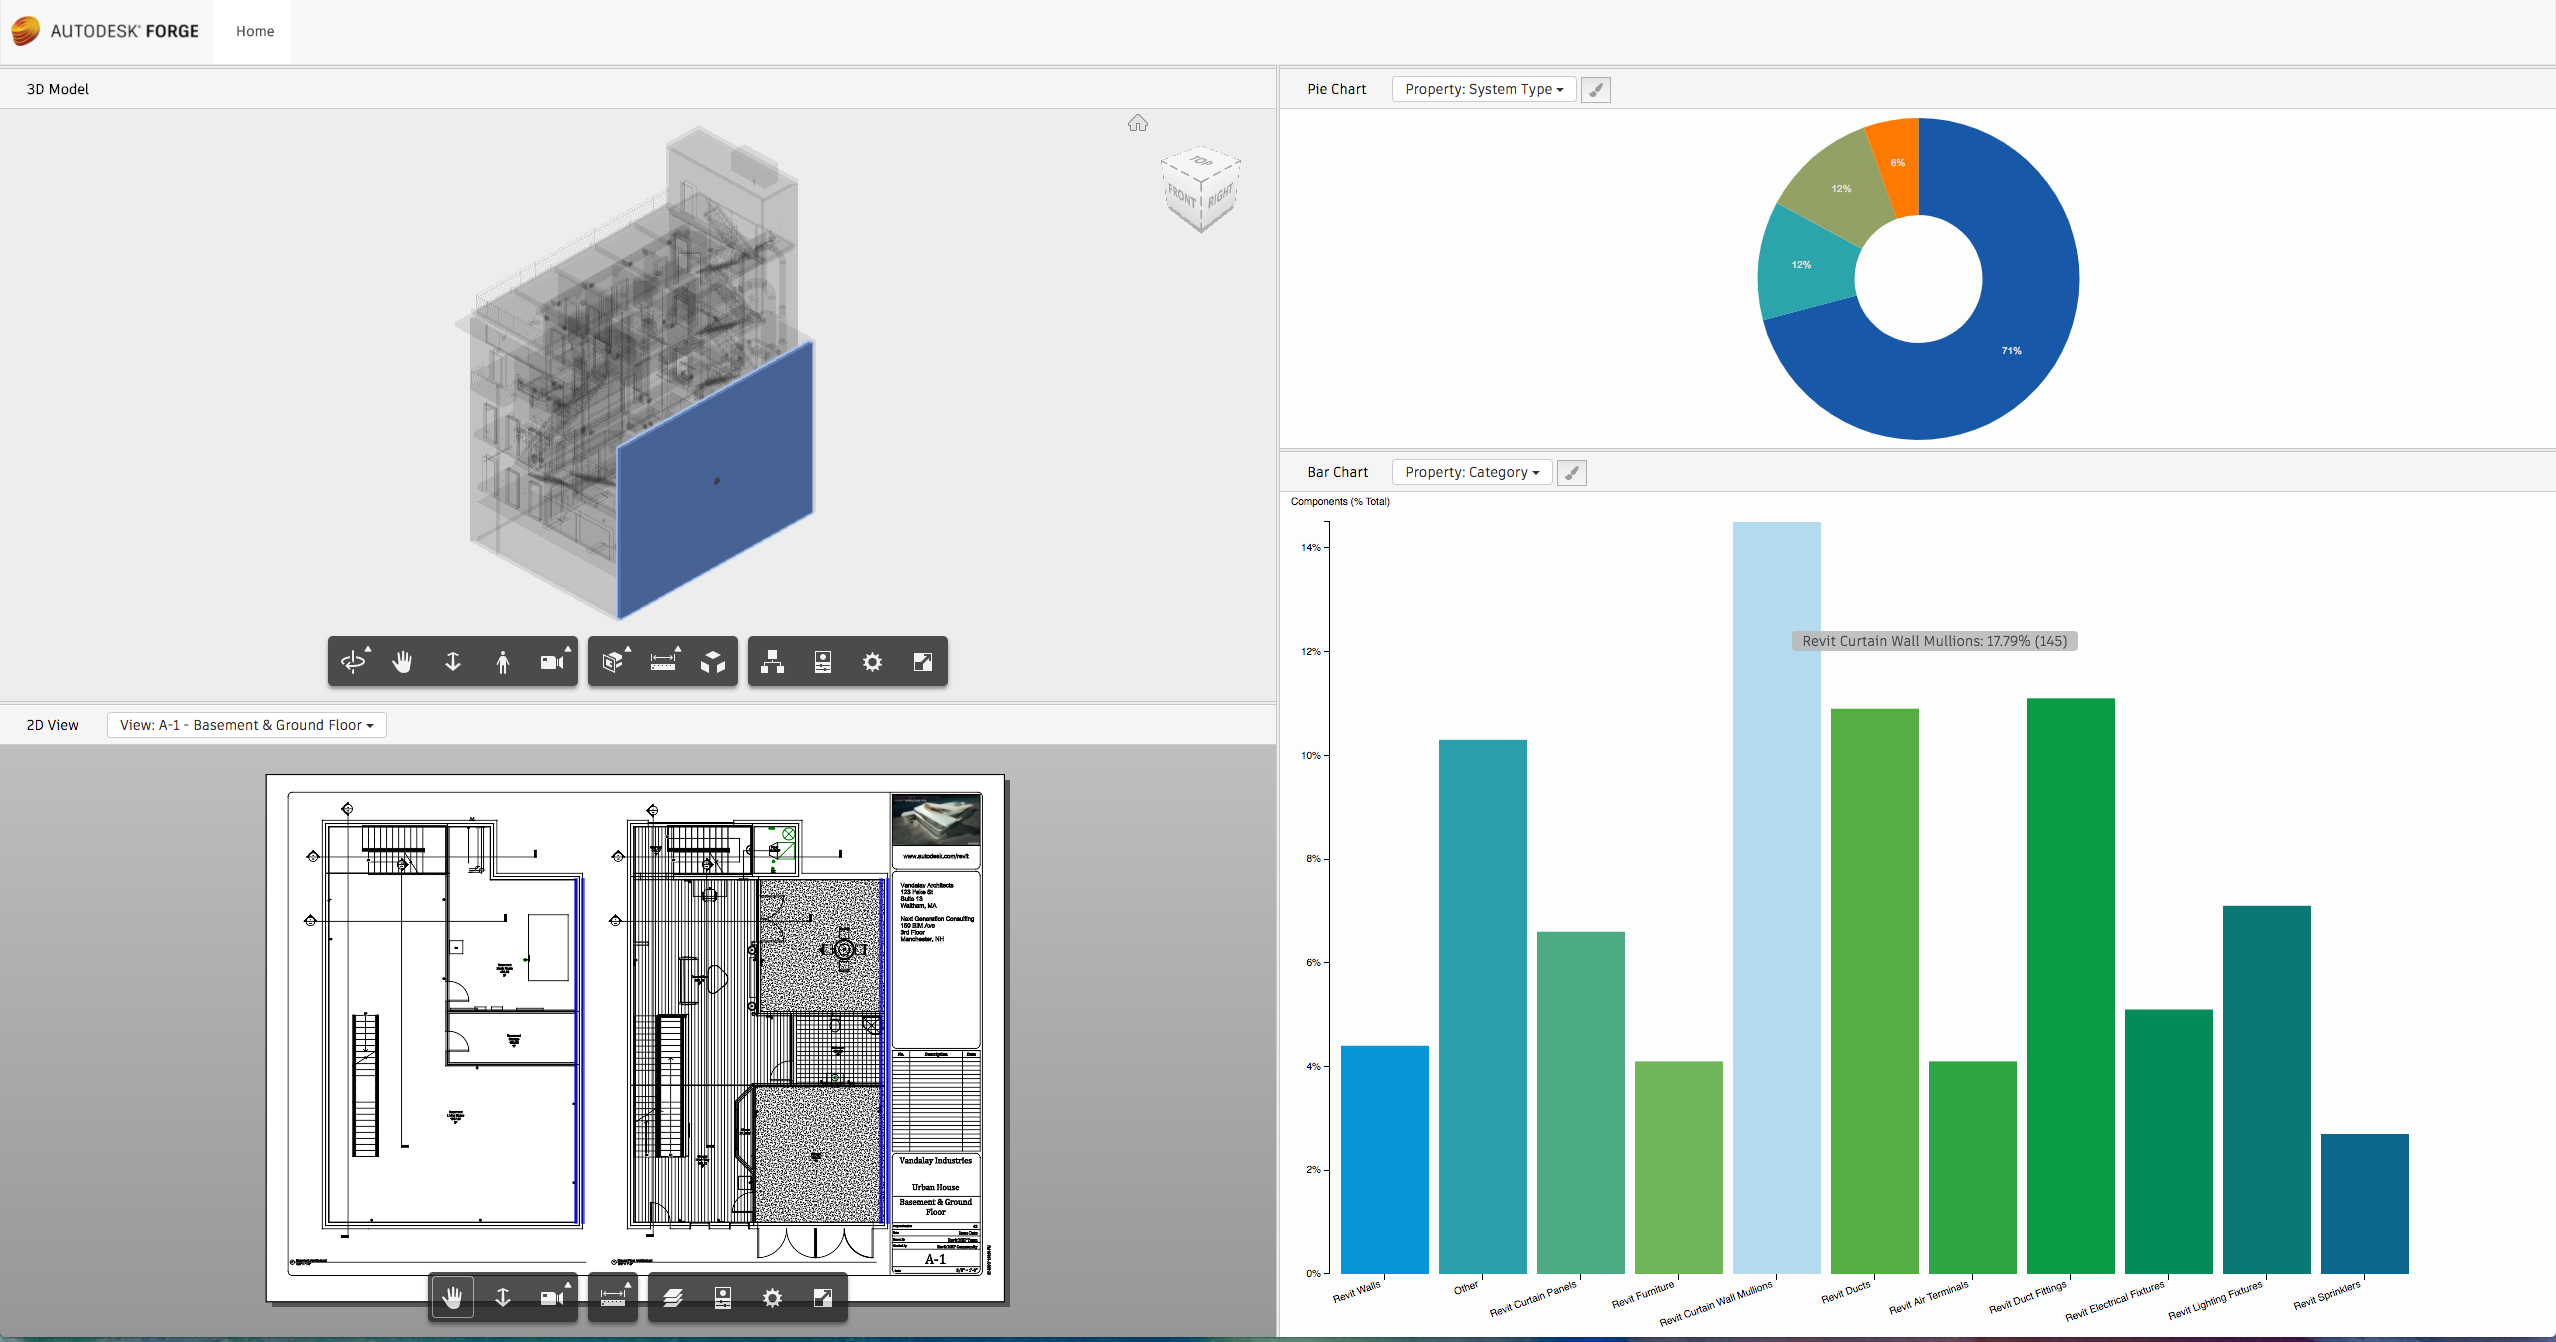
Forge AEC Visual Reports
Description
Description
This example demonstrates the reporting capability of Autodesk Forge Viewer. Select the model from the Home page to see the 2D and 3D representations of the model in the left pane. If the model has a 2D sheet, it will also be loaded along with a visual report showing the vital statistics of the model.
Additionally, you can view charts representing the quantity of the objects based on the selected attributes, such as types or materials. You can click on a wedge in the pie chart to highlight the corresponding objects in the model.
Running the sample
Configuration is controlled by NODE_ENV environment variable, make sure to set it properly to development or production, based on the configuration type you want to run.
In development, the client is dynamically built by the webpack-dev-middleware, so just run:
-
npm install(downloads project dependencies locally) -
npm start(builds client on the fly and run server) -
open http://localhost:3000 in your favorite browser
In production, the client requires a build step, so run:
-
npm install(not required if you already run at previous step) -
npm run build-prod && npm start(builds client and run server) -
open http://localhost:3000 in your favorite browser
License
That samples are licensed under the terms of the MIT License.
Written by
Jaime Rosales D.

Forge Partner Development
Forge Developer Portal


