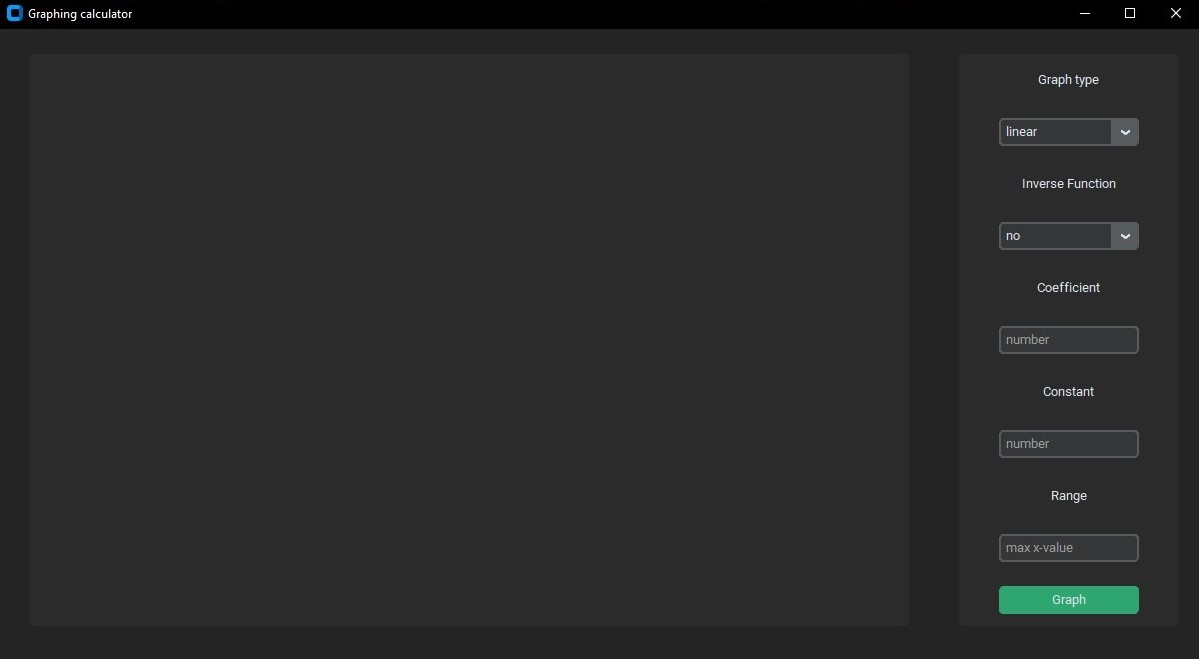
A simple graphing calculator with a graphical user interface
The project runs on python and use matplotlib and customtkinter for data visualization
Clone the project files to your local repository:
- HTTPS =>
https://github.com/edd-ie/Graphing_Calculator-py.git - SSH =>
git@github.com:edd-ie/Graphing_Calculator-py.git - Git CLI =>
gh repo clone edd-ie/Graphing_Calculator-py
Open the directory/folder in terminal and install all dependencies using.
pip install -r requirements.txt
After installation run this command to start the app
python GraphUI.py
The app will be launched.
- Select type of graph
- Select if you want the graph as an inverse function
- Proved the coefficient of the function
- Proved the constant of the function
- Proved the max number to be ploted on x-axis
- Click graph
The graph will be plotted on the blank side

Data is represented as a variation of the function:
y = mx+c
Plot function take parameters to fill in the function and empty array are generated for data storage
def plot(fx, inv="no", coefficient=1, constant=0, range_x=1):
    x = []
    y = []
A loop with each value in the given range generates data for the y while current value is appended to the x
A conditional statement decides which function is to be used to get the y value
for i in range(range_x + 1):
    x.append(i)
    match fx:
        case "linear":
            y.append(coefficient * i + constant)
        case "quadratic":
            y.append(coefficient * (i ** 2) + constant)
        case "cubic":
            y.append(coefficient * (i ** 3) + constant)
        case _:
            y.append(coefficient * (i ** 2) + constant)
Finally, if the user wanted an inverse the values of x and y are switch and the program outputs the data
if inv == "yes":
    switch = y
    y = x
    x = switch

return [x, y]
The data is then used to plot the graph of the function
