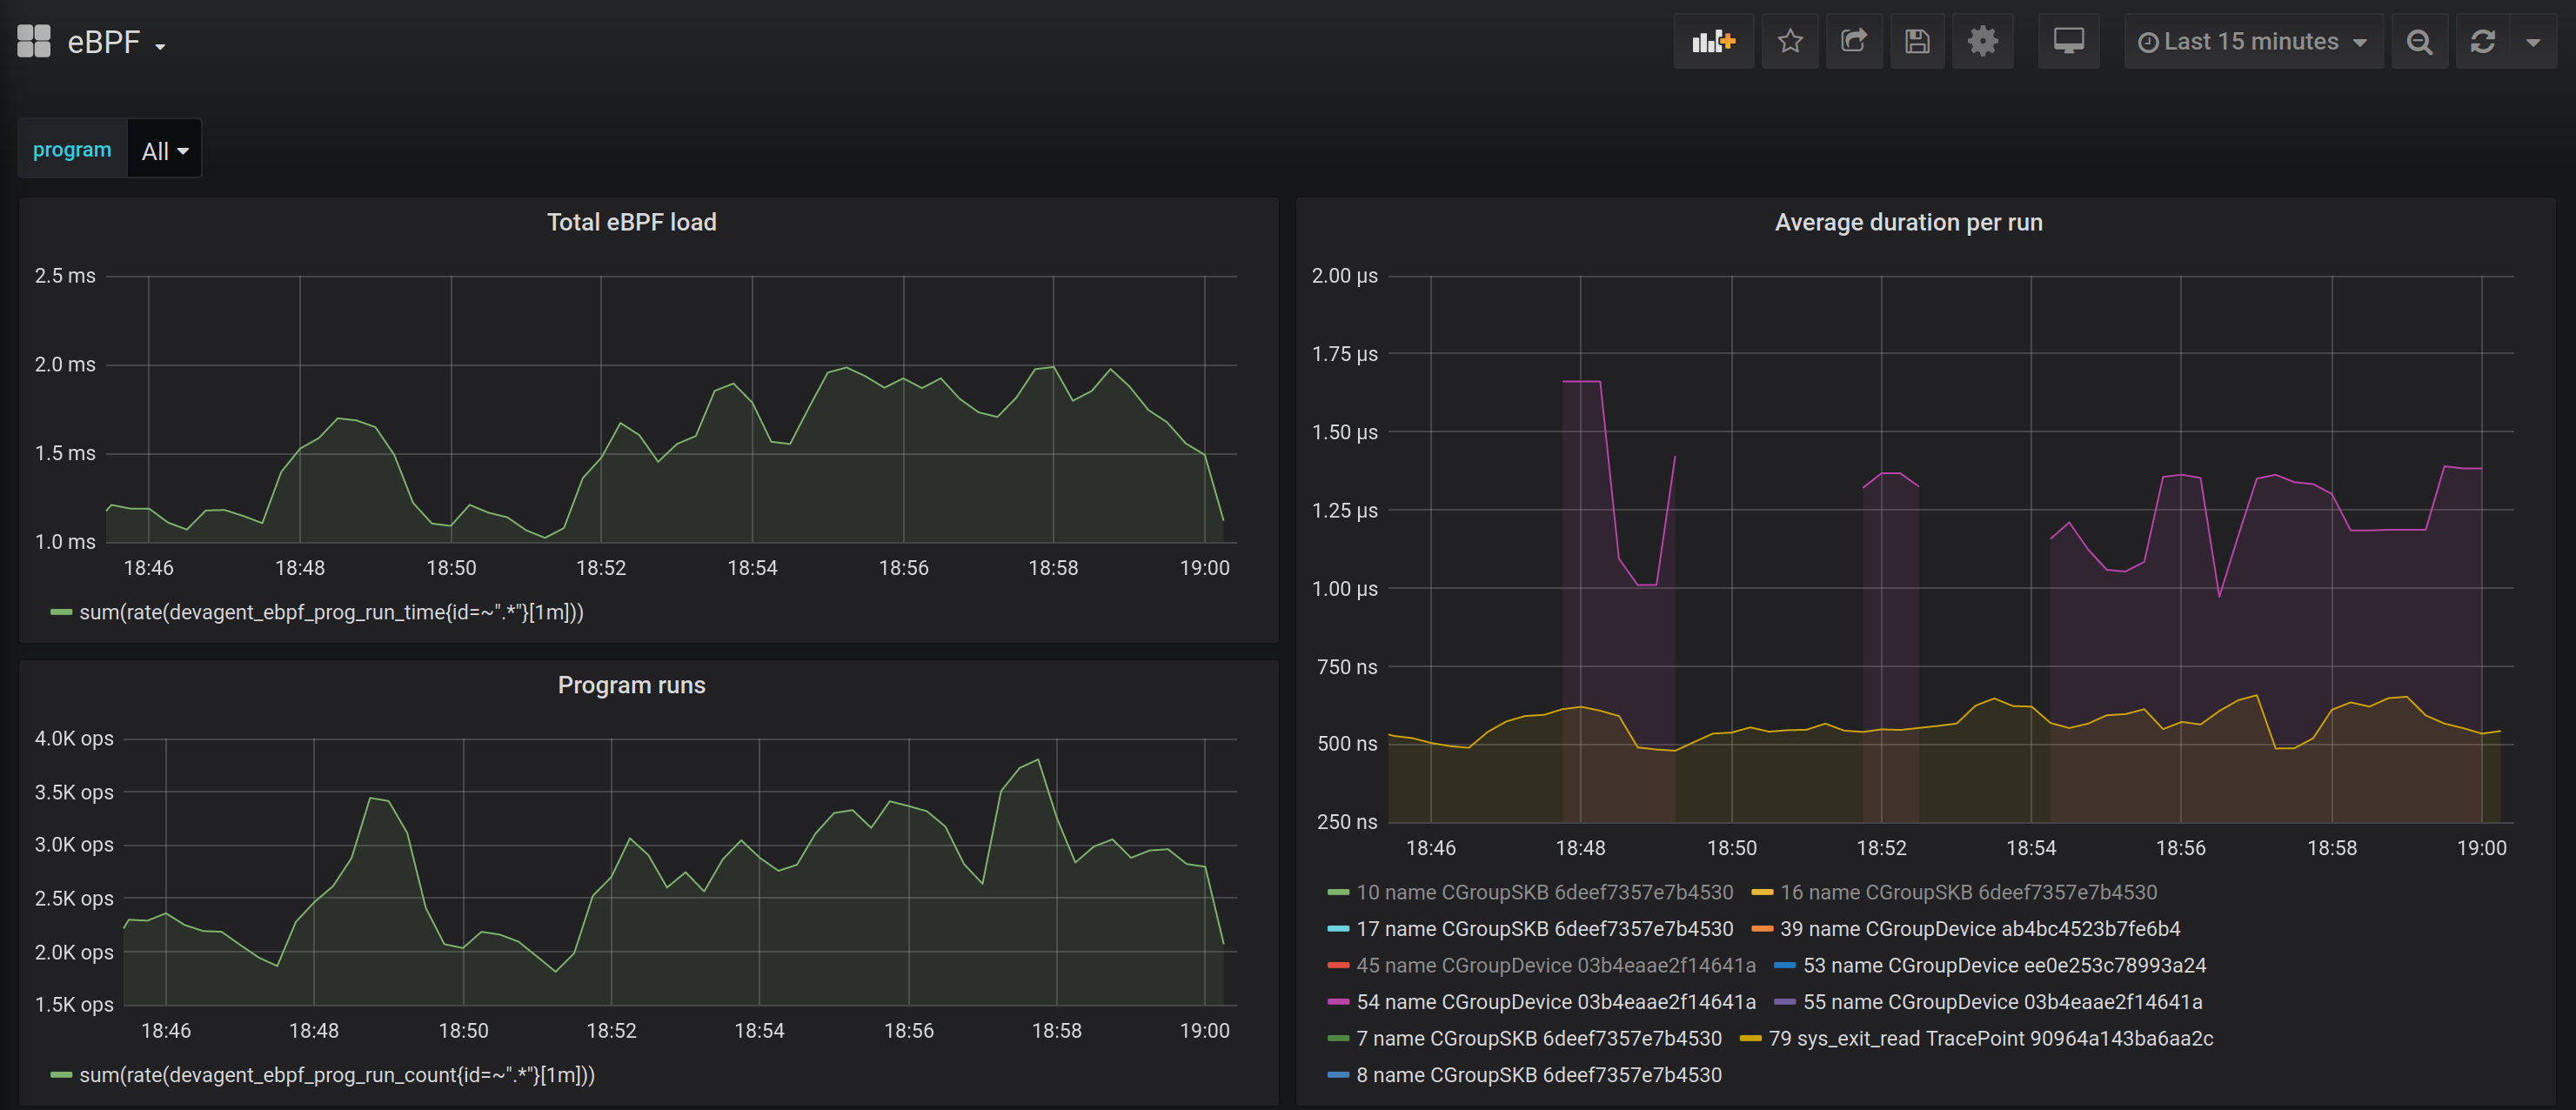
eBPF is a web UI that lets you explore eBPF subsystem of your Linux host.
Explorer consists of two parts: an agent with GraphQL API, Prometheus scrape endpoint, and a web interface. It is currently shipped as a single container. But you can also run them separately.
- ebpfdev/dev-agent, MIT license
- ebpfdev/explorer-ui, MIT license
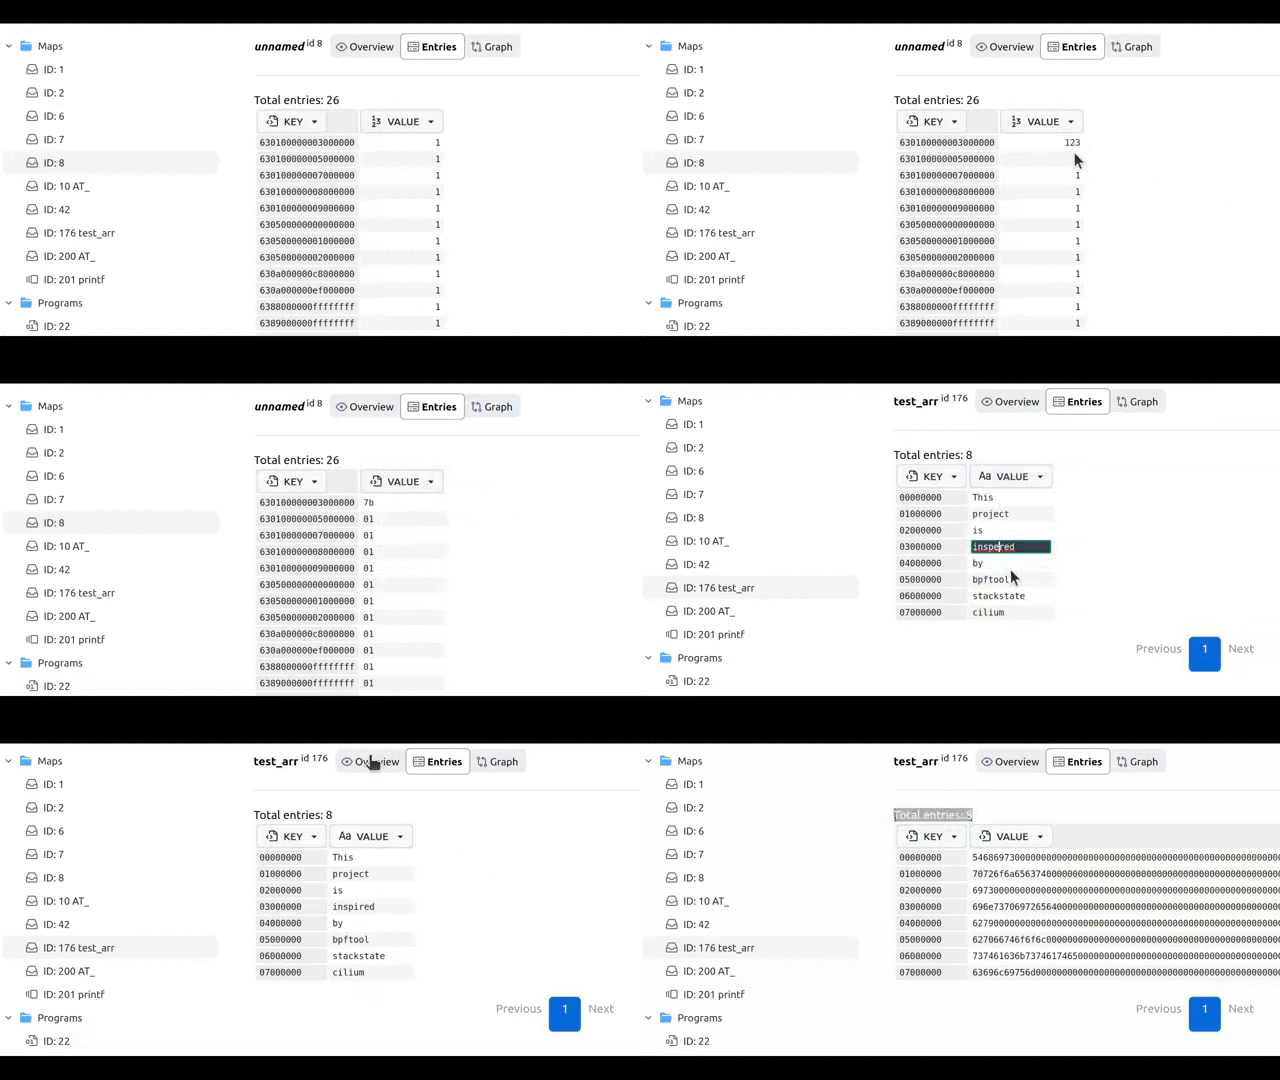
- view all maps and programs
- view graph of interconnected maps and programs
- view program's tracepoints/kprobe
- map entries table (Hash, HashPerCPU, Array, ArrayPerCPU)
- view and edit in number/hex/string formats
- expose map entries as metrics for prometheus (also other useful metrics)
Run explorer as a container:
docker run -ti --rm -p 8070:80 \
  --cap-add CAP_SYS_ADMIN --pid=host \
  -e BPF_DIR=/sys/fs/bpf -v /sys/fs/bpf:/sys/fs/bpf \
  ghcr.io/ebpfdev/explorer:v0.0.7
Privileges breakdown:
-
--cap-add CAP_SYS_ADMIN(required)is needed for access BPF maps and programs (CAP_BPF is not yet enough)
-
--pid=host(optional)is needed to determine tracepoint/kprobe attachment
-
-e BPF_DIR=/sys/fs/bpf -v /sys/fs/bpf:/sys/fs/bpf(optional)is needed to determine paths of pinned maps, it is better to keep BPF_DIR (and target mount path) the same as your original eBPF FS, which can be determined with the following command:
$ mount | grep bpf
bpf on /sys/fs/bpf type bpf
Use --etm option to expose map (with name AT_) entries values to Prometheus endpoint:
docker run -ti --rm -p 8070:80 \
  --cap-add CAP_SYS_ADMIN --pid=host \
  -e BPF_DIR=/sys/fs/bpf -v /sys/fs/bpf:/sys/fs/bpf \
  ghcr.io/ebpfdev/explorer:v0.0.7 --etm -:AT_:string
If you only need GraphQL / Prometheus without web interface, you can run agent independently:
docker run -ti --rm -p 8080:8080 \
  --cap-add CAP_SYS_ADMIN --pid=host \
  -e BPF_DIR=/sys/fs/bpf -v /sys/fs/bpf:/sys/fs/bpf \
  ghcr.io/ebpfdev/dev-agent:v0.0.5 server
Links:
- http://localhost:8070 - web interface
- http://localhost:8070/dev-agent - Agent's GraphQL web client
- http://localhost:8070/dev-agent/metrics - Prometheus scrape endpoint
Run the explorer as described above and open http://localhost:8070 in your browser.
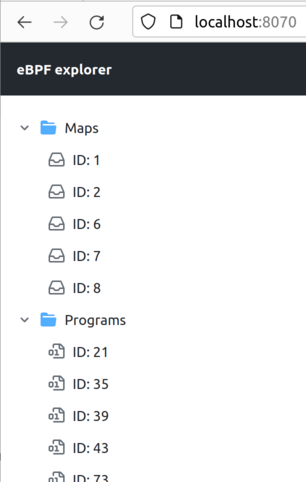
You should see a file tree view with a list of eBPF programs and maps:
Let's use bpftrace to track amount of data read by each process:
$ sudo bpftrace -e 'tracepoint:syscalls:sys_exit_read /args->ret/ { @[comm] = sum(args->ret); }'
Attaching 1 probe...
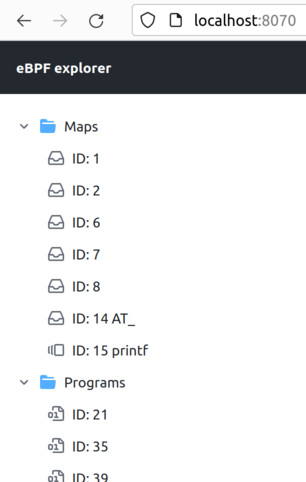
Once you run it, list will be automatically updated:
...
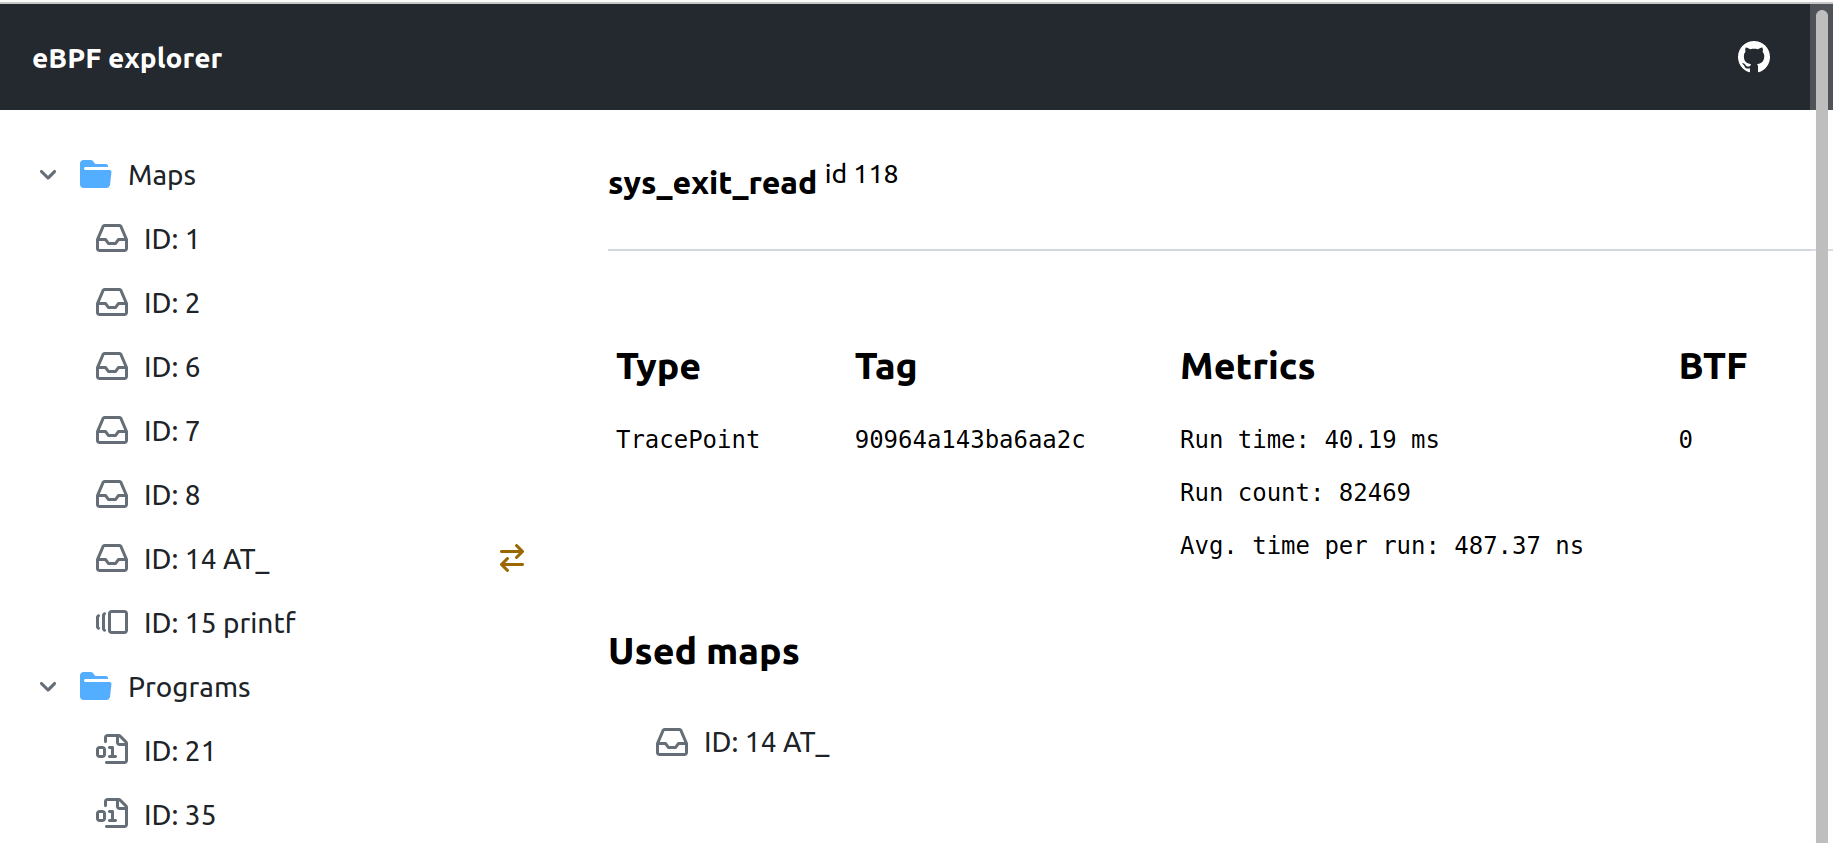
Let's examine the sys_exit_read program:
We can see that this new program is using a new map called AT_.
Which probably means that it contains state of @ variable of the program generated by bpftrace.
There is also printf map of type PerfEventArray. It is probably used by printf() invocation within bpftrace programs
and created regardless of whatever you actually use it or not: out program doesnt use it therefore we also
don't see that is used by the program in UI.
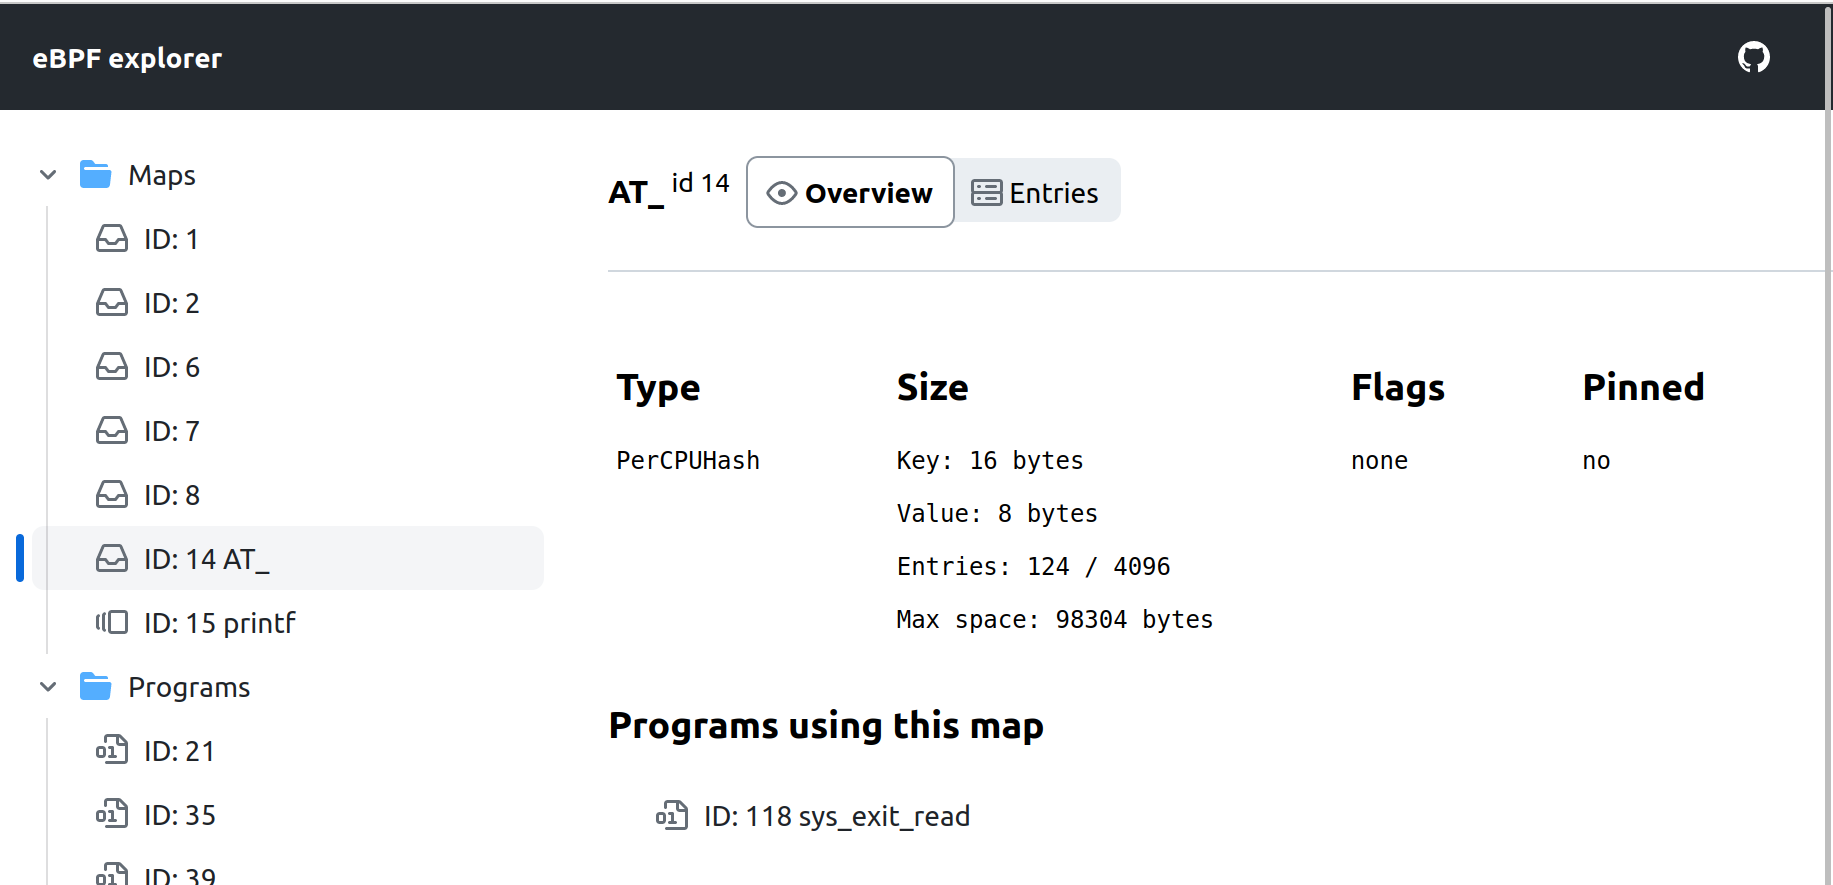
We can proceed to the AT_ map page:
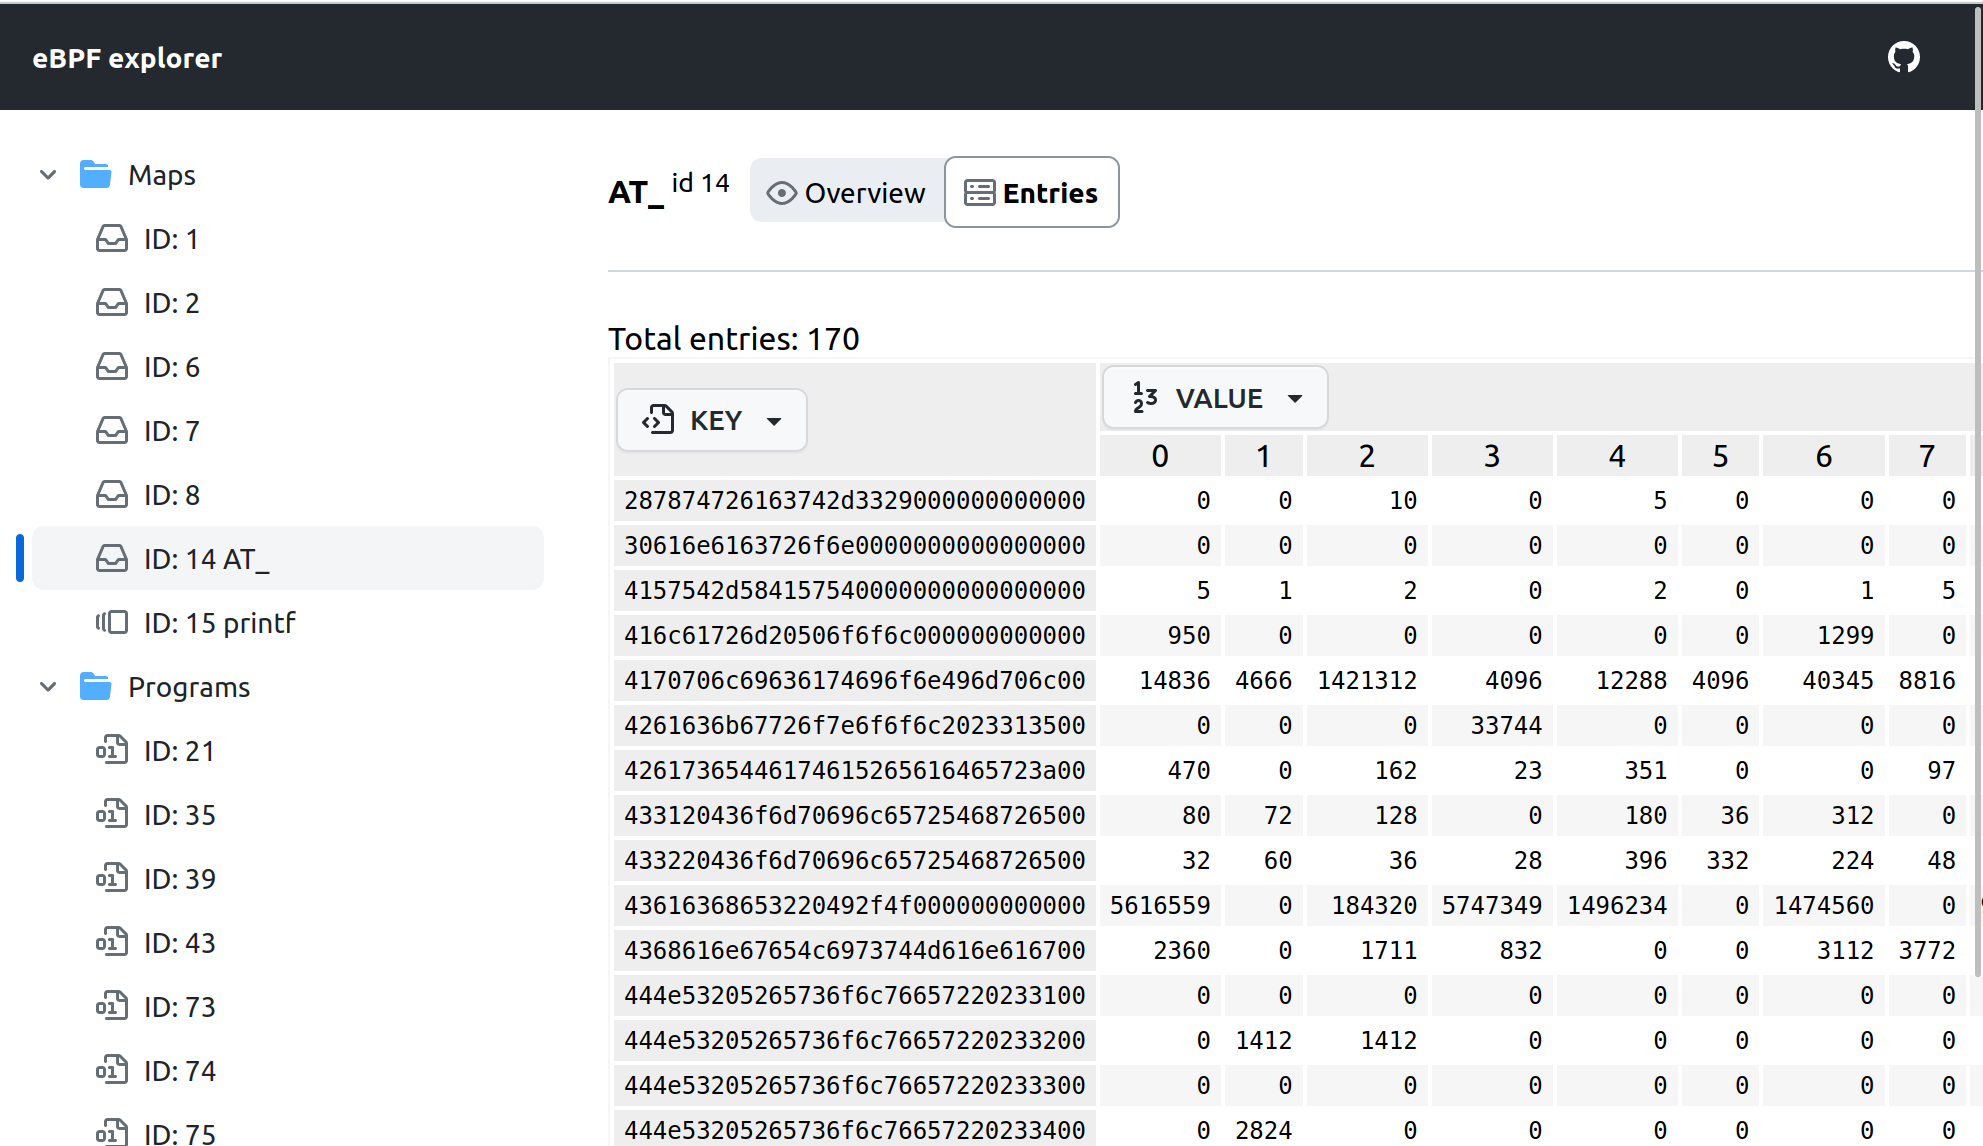
On the Entries subpage we can examine current state of the map:
Values are formatted as numbers by default if value size <= 8 bytes. Otherwise, they are displayed as hex strings.
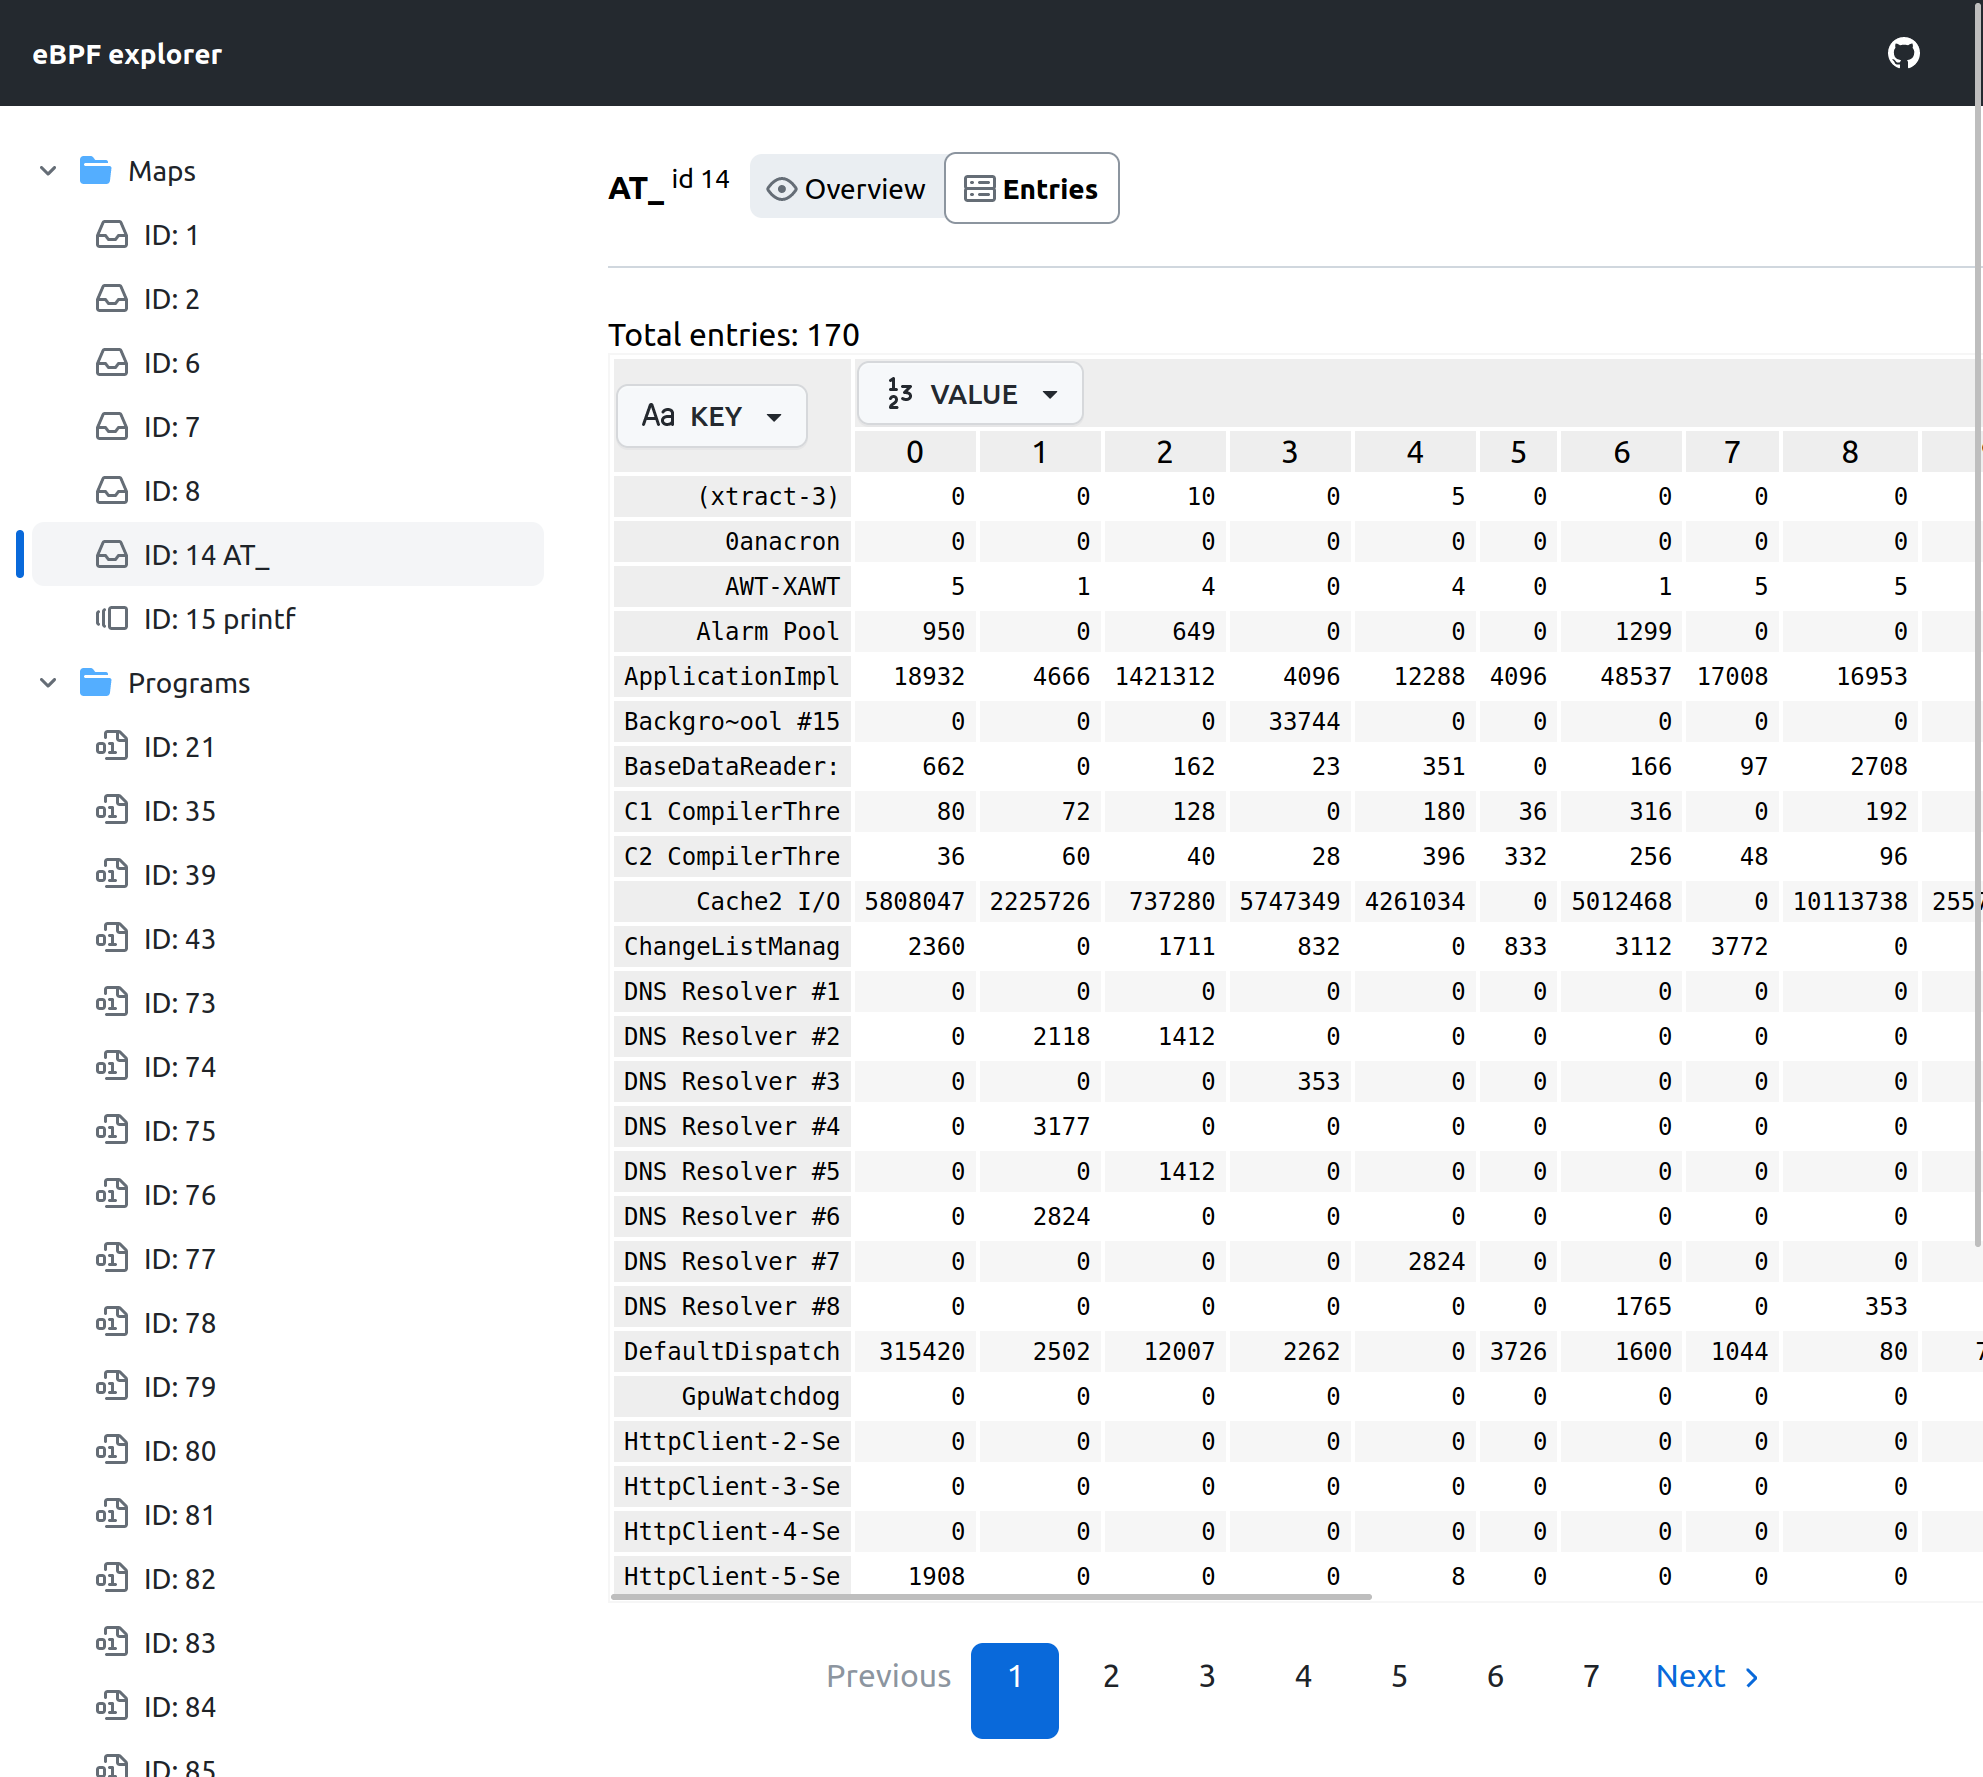
We can also switch KEY representation to string:
There is a scrape endpoint for Prometheus available at /metrics path:
% curl http://localhost:8070/metrics
# HELP devagent_ebpf_map_count Number of eBPF maps
# TYPE devagent_ebpf_map_count gauge
devagent_ebpf_map_count{type="Hash"} 5
devagent_ebpf_map_count{type="PerCPUHash"} 1
devagent_ebpf_map_count{type="PerfEventArray"} 1
# HELP devagent_ebpf_map_entry_count Number of entries in an eBPF map
# TYPE devagent_ebpf_map_entry_count gauge
devagent_ebpf_map_entry_count{id="14",name="AT_",type="PerCPUHash"} 351
# HELP devagent_ebpf_map_entry_value Value of an eBPF map entry
# TYPE devagent_ebpf_map_entry_value gauge
devagent_ebpf_map_entry_value{cpu="0",id="14",key="(xtract-3)",name="AT_",type="PerCPUHash"} 0
devagent_ebpf_map_entry_value{cpu="0",id="14",key="000resolvconf",name="AT_",type="PerCPUHash"} 0
# (...)
devagent_ebpf_map_entry_value{cpu="15",id="14",key="01-ifupdown",name="AT_",type="PerCPUHash"} 0
# (...)
# HELP devagent_ebpf_prog_count Number of eBPF programs
# TYPE devagent_ebpf_prog_count gauge
devagent_ebpf_prog_count{type="CGroupDevice"} 19
devagent_ebpf_prog_count{type="CGroupSKB"} 10
devagent_ebpf_prog_count{type="TracePoint"} 1
# HELP devagent_ebpf_prog_run_count Number of times an eBPF program has been run
# TYPE devagent_ebpf_prog_run_count gauge
devagent_ebpf_prog_run_count{id="112",name="",tag="03b4eaae2f14641a",type="CGroupDevice"} 0
devagent_ebpf_prog_run_count{id="113",name="",tag="03b4eaae2f14641a",type="CGroupDevice"} 0
devagent_ebpf_prog_run_count{id="114",name="",tag="03b4eaae2f14641a",type="CGroupDevice"} 54
devagent_ebpf_prog_run_count{id="118",name="sys_exit_read",tag="90964a143ba6aa2c",type="TracePoint"} 2.866732e+06
devagent_ebpf_prog_run_count{id="127",name="",tag="3918c82a5f4c0360",type="CGroupDevice"} 7
# (...)
# HELP devagent_ebpf_prog_run_time Total time spent running eBPF programs
# TYPE devagent_ebpf_prog_run_time gauge
devagent_ebpf_prog_run_time{id="112",name="",tag="03b4eaae2f14641a",type="CGroupDevice"} 0
devagent_ebpf_prog_run_time{id="113",name="",tag="03b4eaae2f14641a",type="CGroupDevice"} 0
devagent_ebpf_prog_run_time{id="114",name="",tag="03b4eaae2f14641a",type="CGroupDevice"} 6.857e-05
devagent_ebpf_prog_run_time{id="118",name="sys_exit_read",tag="90964a143ba6aa2c",type="TracePoint"} 1.405393686
devagent_ebpf_prog_run_time{id="127",name="",tag="3918c82a5f4c0360",type="CGroupDevice"} 2.314e-06
# (...)
By default, metrics devagent_ebpf_map_entry_count and devagent_ebpf_map_entry_value are disabled.
To enable them for some of the maps (Array or Hash types), use --etm option, for the demo above:
docker run -ti --rm -p 8070:80 \
  --cap-add CAP_SYS_ADMIN --pid=host \
  -e BPF_DIR=/sys/fs/bpf -v /sys/fs/bpf:/sys/fs/bpf \
  ghcr.io/ebpfdev/explorer:v0.0.7 --etm -:AT_:string
Run with --help to see details of this option:
% docker run -ti --rm ghcr.io/ebpfdev/explorer:v0.0.7 --help

  (edited)

   --entries-to-metrics value, --etm value [ --entries-to-metrics value, --etm value ]  (experimental, api may change)
    Configure which map entries should be exposed as metrics, in the format: id_start-id_end:metric_name_regexp:key_format.
    Example: '-:.+:string' to export any map with non-empty name while treating key as string.
    or '10-:.*:hex' to export any map after ID 10 with key represented in HEX format
    Available key formats: string, number, hex
    If a map matches multiple entries, the first one is used.

  (edited)
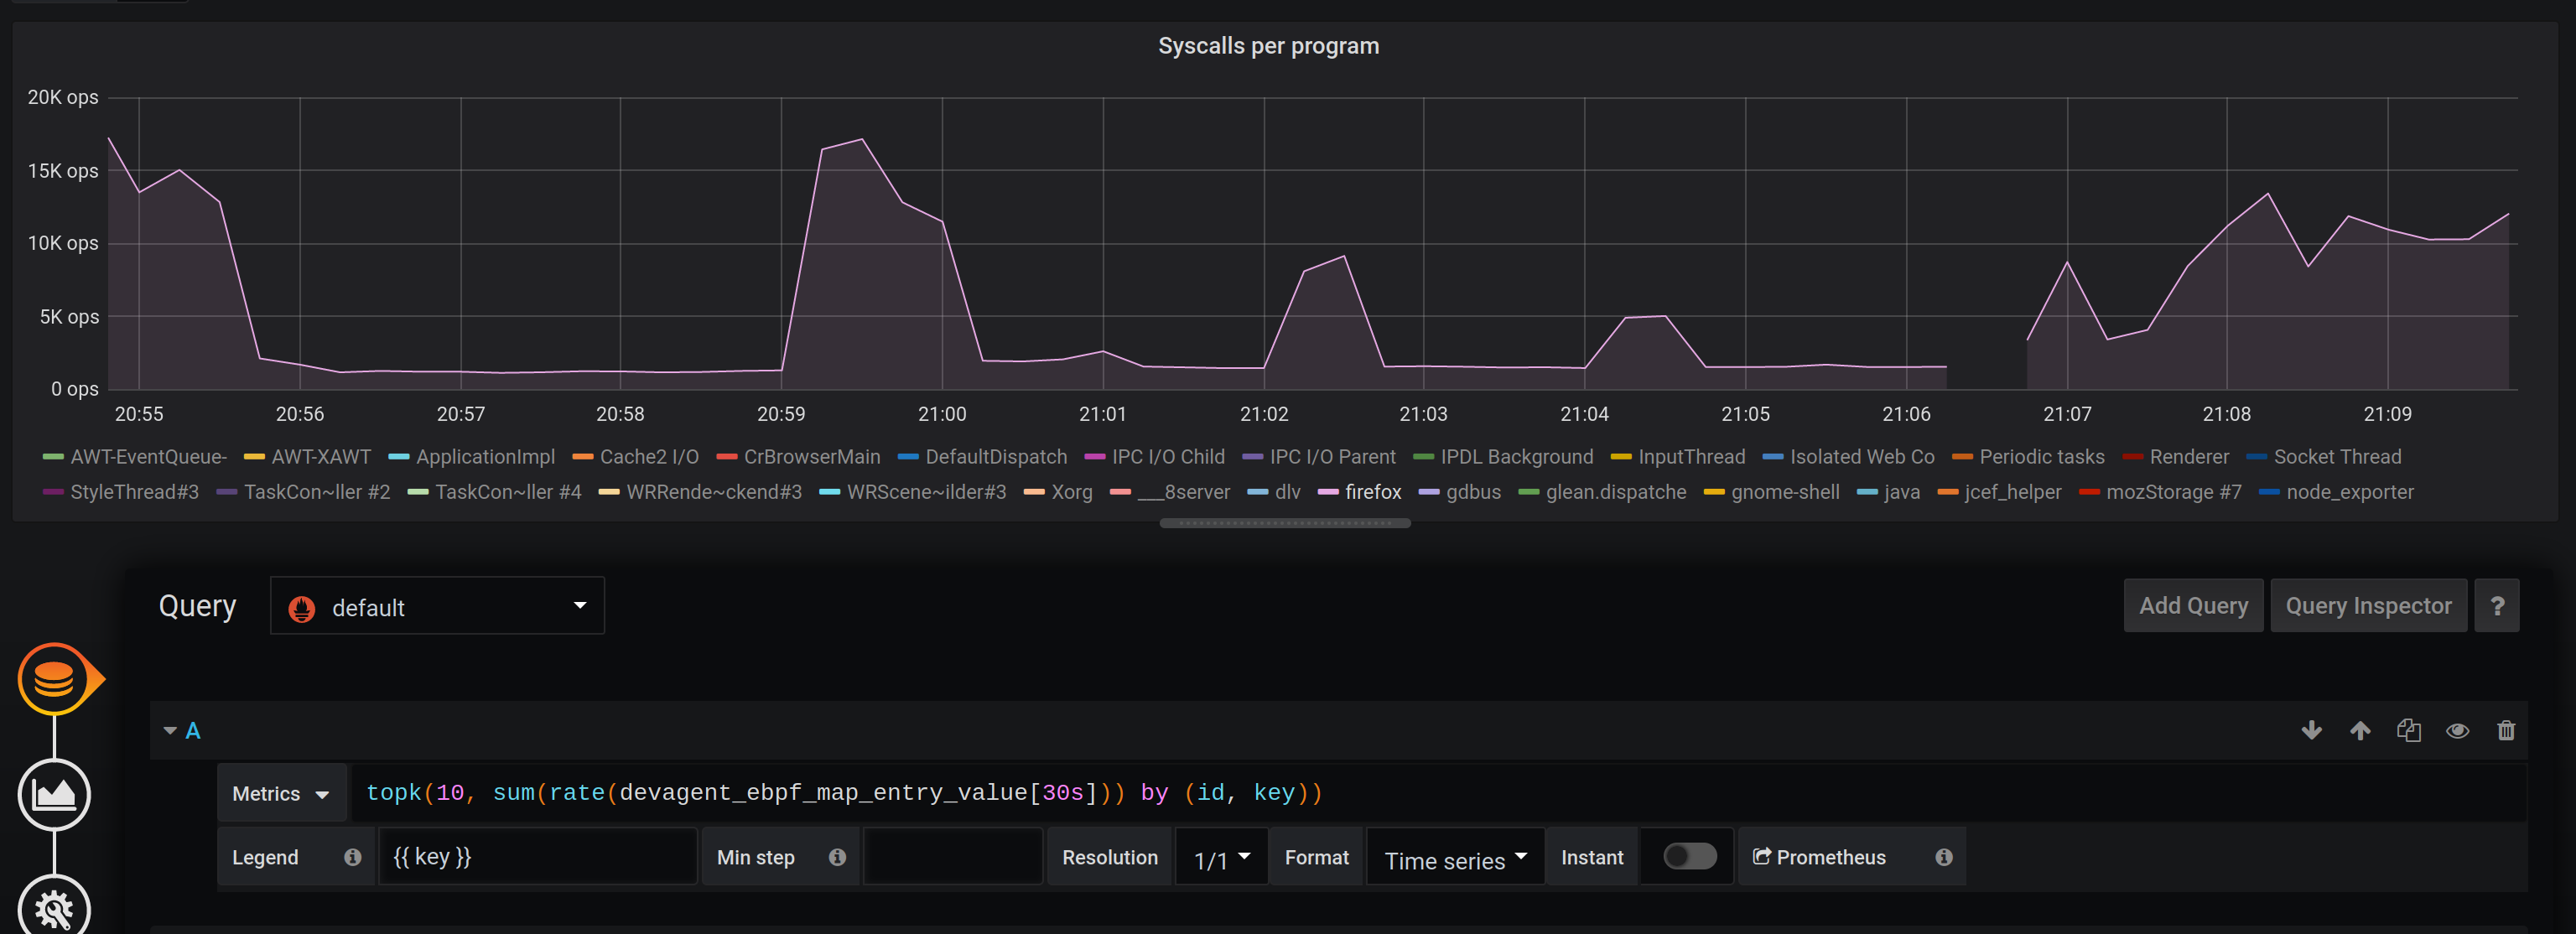
Some interesting visualization you could build with this data:
Amount of system calls per process:
-
list of eBPF programs + details page
-
list of eBPF maps + details page
-
showing bounded maps of a programs (and vice versa)
-
showing map content
- Hash (+ per CPU)
- Array (+ per CPU)
- others are planned
-
program introspection
- eBPF bytecode
- JIT disassembly
-
visualization of map's content
Like plotting a chart of values of maps keys
-
program execution profiling
I plan to keep track of duration/number of executions of a programs provided by kernel to draw nice charts
-
cluster support
To traverse over a cluster of agents within a single interface
Feedback and suggestions are welcome in GitHub Issues or via alex@hsslb.ch
