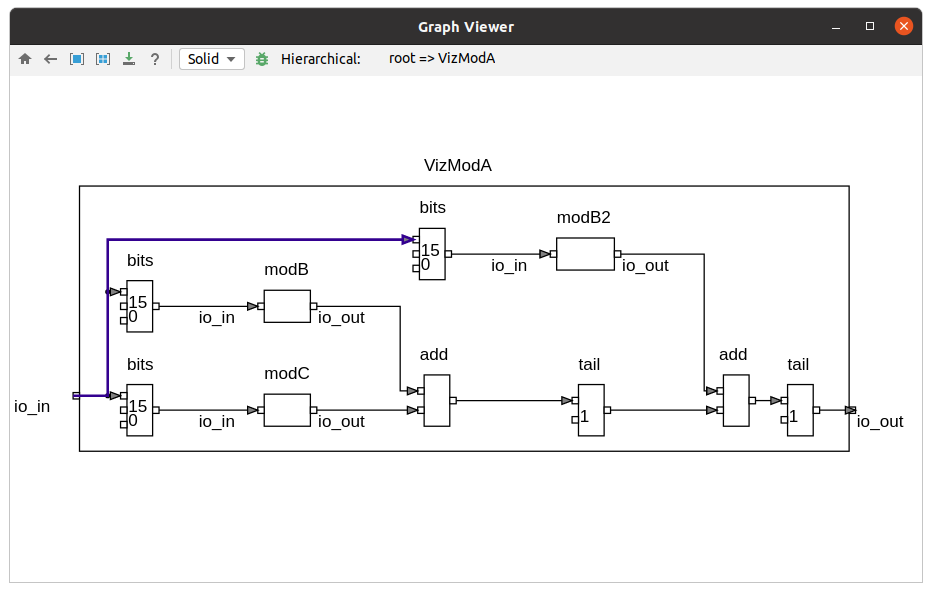
Note1: This project is suitable for viewing the connection relationship between circuit modules at a high level. If a module is too detailed, such as containing thousands of primitive operations, it is meaningless to visualize such a module, and it will take a lot of time and resources to render the graph.
Note2: In addition to layout the graph through various algorithms, the generated graph file can be consumed by ELK to create a corresponding graph data structure, and circuit analysis can be performed based on the graph.
- Go to Top module
- Double-click go to submodule
- Go back
- Center selection, or if nothing is selected center the entire diagram
- Zoom selection to fill the entire canvas, or if nothing is selected zoom the entire diagram
- Export diagram to SVG
- Highlight selected elements
-
How to view the graph file
After generating graph files by easysoc-firrtl, when you open a
.graphfile or right-click on it, menuHDL->Rendering the Graph Interactivelybecomes available.When opening the graph for the first time, some initialization work is required. After that, the rendering of the graph will be very fast.
-
How to view the exported SVG file
The rendering effect of the diagram is mainly adapted to Chrome browser, other SVG viewers may see inconsistent effects. It is recommended to use Chrome browser and SVG Navigator plugin to see the SVG file.
