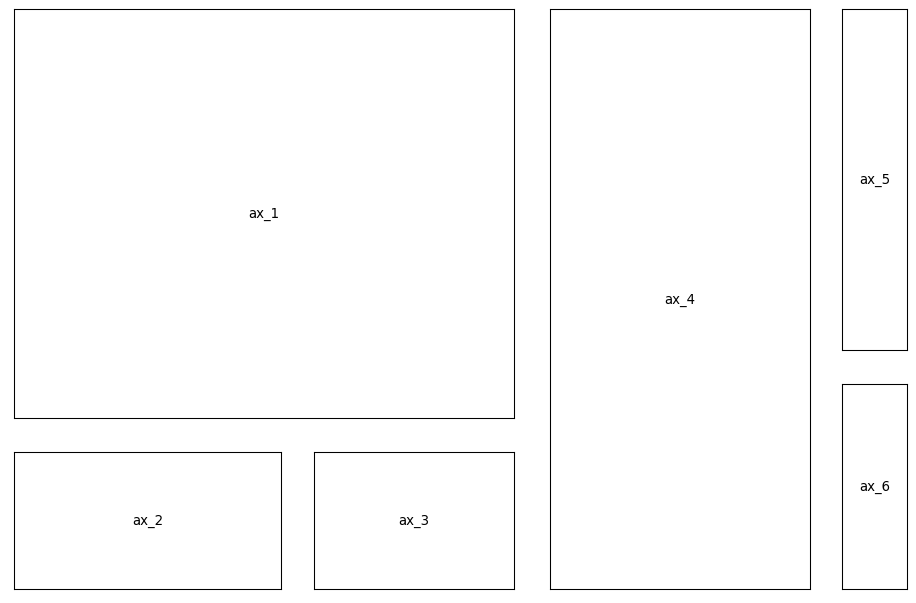
Matplotlib can be used to create plots with arbitrary layouts by using GridSpec and GridSpecFromSubplotSpec, but doing so is fairly cumbersome.
The purpose of this library is to make the process as trivial as possible:
from matplotlib_autolayout import generate_layout

# use ascii-art to specify the layout
# get the figure, a dictionary of axes,
# and the grid specifications
fig, axes, gridspecs = generate_layout('''
111111144445
111111144445
111111144445
111111144445
111111144445
111111144446
222233344446
222233344446
''')

# annotate the name of each axis in the center
for name, ax in axes.items():
    ax.annotate(name, (0.5, 0.5), ha='center', va='center')
    ax.set_xticks([])
    ax.set_yticks([])
In case you need to tweak the layout, you can generate the source code and simply copy-paste it in your project:
from matplotlib_autolayout import generate_source_code

generate_source_code('''
113
223
''')
This will print the necessary code to create the layout:
import matplotlib as mpl
import matplotlib.pyplot as plt
fig = plt.figure(figsize=(12, 8), dpi=96)

gridspecs = {}
axes = {}

gridspecs["gs_123"] = mpl.gridspec.GridSpec(
    figure=fig,
    nrows=1,
    ncols=2,
    height_ratios=[2],
    width_ratios=[2, 1],
    wspace=0.39999999999999997,
    hspace=0.25,
)

gridspecs["gs_12"] = mpl.gridspec.GridSpecFromSubplotSpec(
    subplot_spec=gridspecs["gs_123"][0],
    nrows=2,
    ncols=1,
    height_ratios=[1, 1],
    width_ratios=[2],
    wspace=0.3,
    hspace=0.5,
)
axes["ax_1"] = fig.add_subplot(gridspecs["gs_12"][0])
axes["ax_2"] = fig.add_subplot(gridspecs["gs_12"][1])

gridspecs["gs_3"] = mpl.gridspec.GridSpecFromSubplotSpec(
    subplot_spec=gridspecs["gs_123"][1],
    nrows=1,
    ncols=1,
    height_ratios=[2],
    width_ratios=[1],
    wspace=0.6,
    hspace=0.25,
)
axes["ax_3"] = fig.add_subplot(gridspecs["gs_3"][0])

for name, ax in axes.items():
    ax.annotate(name, (0.5, 0.5), ha="center", va="center")
This functionality is also implemented in a command-line utility by running the module:
$ python -m matplotlib_autolayout --help
Usage: __main__.py [OPTIONS] [ART_FILE]

  Reads the layout ascii-art from a file (or stdin) and generates the
  necessary matplotlib code.

Options:
  -s, --show                  Preview the plot
  -ws, --wspace FLOAT         Horizontal separation between axes
  -hs, --hspace FLOAT         Vertical separation between axes
  -w, --width FLOAT           Figure width in inches
  -h, --height FLOAT          Figure height in inches
  -wf, --width-factor FLOAT   To determine the width, each character in the
                              ascii-artcorresponds to this many inches.
                              Overrides `width`.

  -wh, --height-factor FLOAT  To determine the height, each character in the
                              ascii-artcorresponds to this many inches.
                              Overrides `height`.

  -d, --dpi FLOAT             Dots-per-inch of the figure
  --help                      Show this message and exit.
Via pip:
pip install git+https://github.com/e-dorigatti/matplotlib-autolayout/
