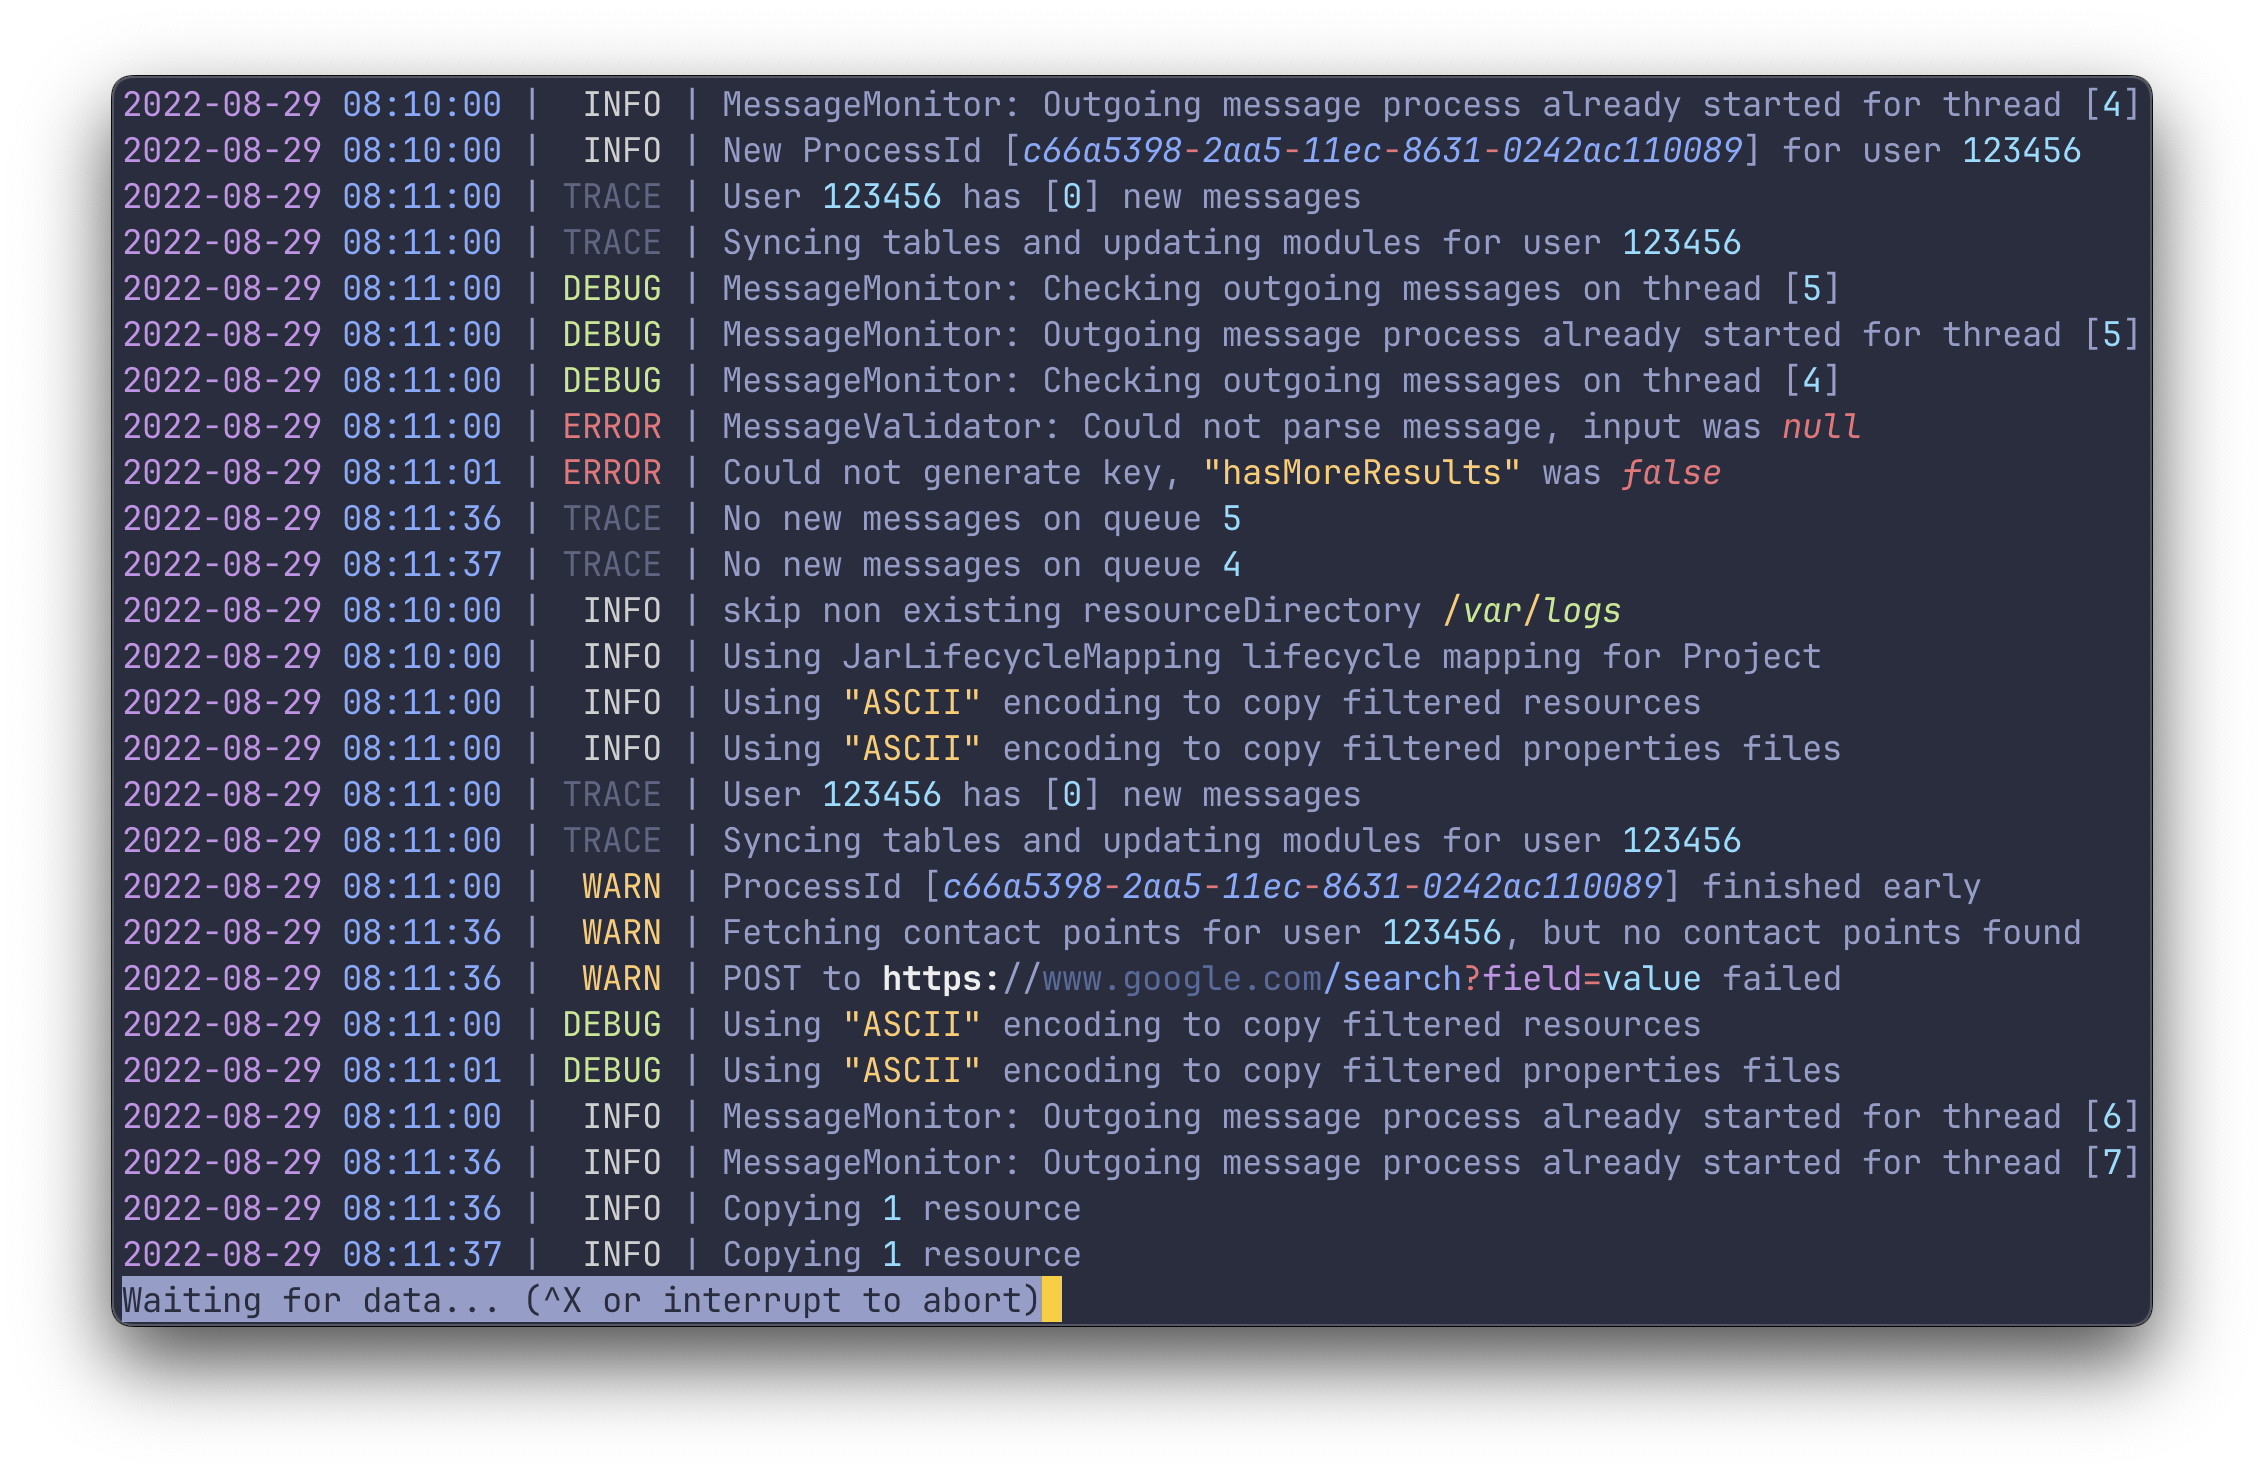
A log file highlighter
- 🪵 View (or
tail) any log file of any format - 🍰 No setup or config required
- 🌈 Highlights numbers, dates, IP-addresses, UUIDs, URLs and more
- ⚙️ All highlight groups are customizable
- 🧬 Easy to integrate with other commands
- 🔍 Uses
lessunder the hood for scrollback, search and filtering
- Overview
- Installing
- Highlight Groups
- Watching folders
- Customizing Highlight Groups
- Working with
stdinandstdout - Using the pager
less - Settings
tailspin works by reading through a log file line by line, running a series of regexes
against each line. The regexes recognize patterns like dates, numbers, severity
keywords and more.
tailspin does not make any assumptions on the format or position of the items it wants to highlight. For this reason,
it requires no configuration or setup and will work predictably regardless of the format the log file is in.
The binary name for tailspin is tspin.
# Homebrew
brew install tailspin

# Cargo
cargo install tailspin

# AUR
paru -S tailspin

# Nix
nix-shell -p tailspin

# NetBSD
pkgin install tailspincargo install --path .Binary will be placed in ~/.cargo/bin, make sure you add the folder to your PATH environment variable.
Config
[date]
style = { fg = "magenta" }
# To shorten the date, uncomment the line below
# shorten = { to = "␣", style = { fg = "magenta" } }

[time]
time = { fg = "blue" }
zone = { fg = "red" }
# To shorten the time, uncomment the line below
# shorten = { to = "␣", style = { fg = "blue" } }Config
[[keywords]]
words = ['null', 'true', 'false']
style = { fg = "red", italic = true }

[[keywords]]
words = ['GET']
style = { fg = "black", bg = "green" }
border = true

# You can add as many keywords as you'd likeConfig
[url]
http = { faint = true }
https = { bold = true }
host = { fg = "blue", faint = true }
path = { fg = "blue" }
query_params_key = { fg = "magenta" }
query_params_value = { fg = "cyan" }
symbols = { fg = "red" }Config
[number]
style = { fg = "cyan" }Config
[ip]
segment = { fg = "blue", italic = true }
separator = { fg = "red" }Config
[quotes]
style = { fg = "yellow" }
token = '"'Config
[path]
segment = { fg = "green", italic = true }
separator = { fg = "yellow" }Config
See KeywordsConfig
[uuid]
segment = { fg = "blue", italic = true }
separator = { fg = "red" }Config
[key_value]
key = { faint = true }
separator = { fg = "white" }Config
[process]
name = { fg = "green" }
separator = { fg = "red" }
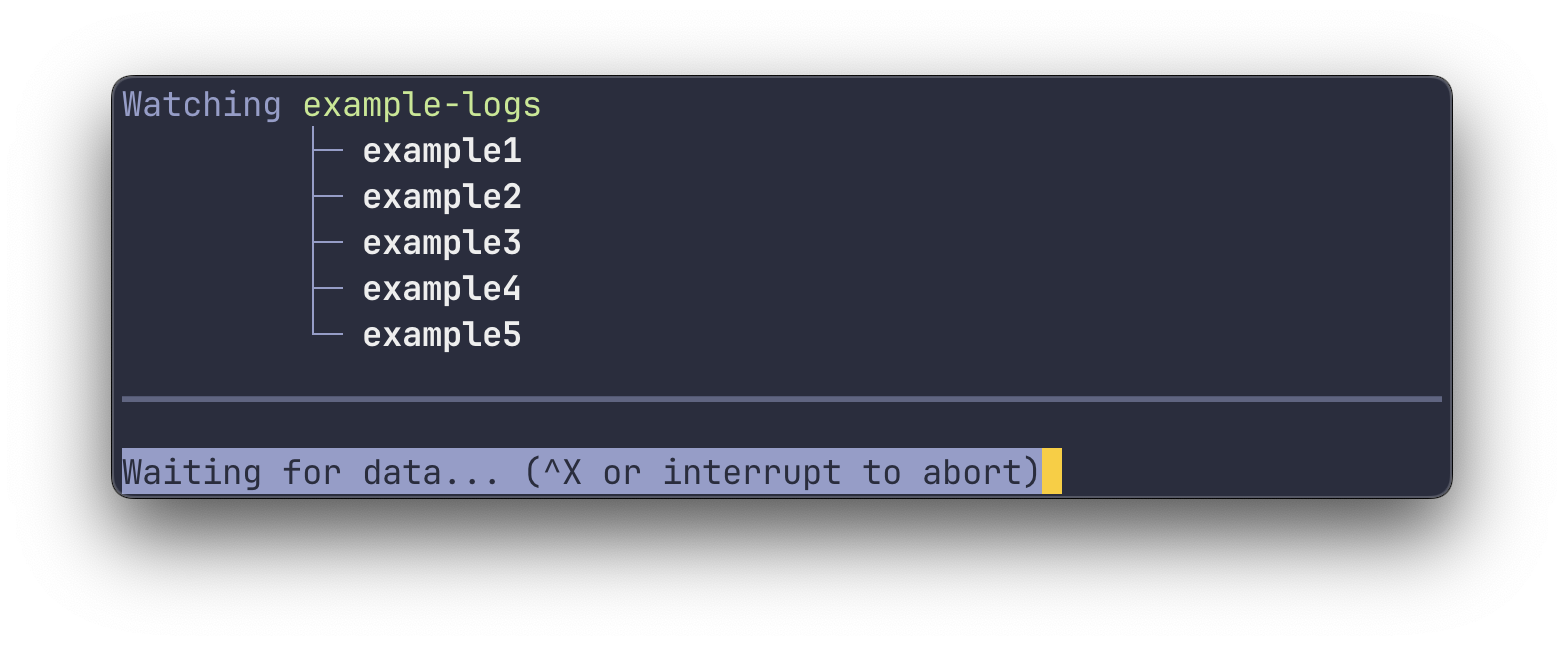
id = { fg = "yellow" }tailspin can listen for newline entries in a given folder. Watching folders is useful for monitoring log files that
are rotated.
When watching folders, tailspin will start in follow mode (abort with Ctrl + C) and will only print
newline entries which arrive after the initial start.
Create config.toml in ~/.config/tailspin to customize highlight groups.
Styles have the following shape:
style = { fg = "color", bg = "color", italic = false, bold = false, underline = false }To disable a highlight group, set the disabled field to true:
[date]
disabled = trueTo add custom keywords, either include them in the list of keywords or add new entries:
[[keywords]]
words = ['MyCustomKeyword']
style = { fg = "green" }

[[keywords]]
words = ['null', 'true', 'false']
style = { fg = "red", italic = true }By default, tailspin will open a file in the pager less. However, if you pipe something into tailspin, it will
print the highlighted output directly to stdout. This is similar to running tspin [file] --print.
To let tailspin highlight the logs of different commands, you can pipe the output of those commands into tailspin
like so:
journalctl -f | tspin
cat /var/log/syslog | tspin
kubectl logs -f pod_name | tspintailspin uses less as its pager to view the highlighted log files. You can get more info on less via the man
command (man less) or by hitting the h button to access the help screen.
Navigating within less uses a set of keybindings that may be familiar to users of vim or other vi-like
editors. Here's a brief overview of the most useful navigation commands:
- j/k: Scroll one line up / down
- d/u: Scroll one half-page up / down
- g/G: Go to the top / bottom of the file
When you run tailspin with the -f or --follow flag, it will scroll to the bottom and print new lines to the screen
as they're added to the file.
To stop following the file, interrupt with Ctrl + C. This will stop the tailing, but keep the file open, allowing you to review the existing content.
To resume following the file from within less, press Shift + F.
Use / followed by your search query. For example, /ERROR finds the first occurrence of
ERROR.
After the search, n finds the next instance, and N finds the previous instance.
less allows filtering lines by a keyword, using & followed by the pattern. For instance, &ERROR shows
only lines with ERROR.
To only show lines containing either ERROR or WARN, use a regular expression: &\(ERROR\|WARN\).
To clear the filter, use & with no pattern.
-f, --follow                 Follow the contents of the file
-t, --tail                   Start at the end of the file
-p, --print                  Print the output to stdout
-c, --config-path PATH       Path to a custom configuration file
-l, --follow-command 'CMD'   Follows the output of the provided command


