ml-project
- 기계학습 프로젝트
- kaggle의 IIM-ISIC Melanoma Classification대회의 데이터를 활용하여 image 데이터와 tabular 데이터를 활용하여 학습을 진행하고자 합니다.
Requirements
이 프로젝트에 썼던 라이브러리들:
- black==20.8b1
- catboost==0.25
- isort==5.8.0
- lightgbm==3.2.0
- numpy==1.19.5
- optuna==2.6.0
- opencv-python==4.5.2.52
- plotly==4.14.3
- pandas==1.2.3
- scikit-image==0.18.1
- scikit-learn==0.24.1
- scipy==1.6.2
- seaborn==0.11.1
- torch==1.8.1+cu111
- torchvision==0.9.1+cu111
- tqdm==4.59.0
- xgboost==1.3.3
데이터 설명
Files
- train.csv - 전체 데이터 셋
- train - 이미지 데이터셋
Columns
- image_name - 환자의 피부 사진 이미지 이름
- patient_id - 환자 고유 번호
- sex - 성별
- age_approx - 대략적인 나이
- anatom_site_general_challenge - 흑색종의 위치
- diagnosis - 진단명
- benign_malignant - 양성인지 악성인지 유무
- target - benign_malignant의 이진화(양성-0, 악성-1)
학습 과정
Process
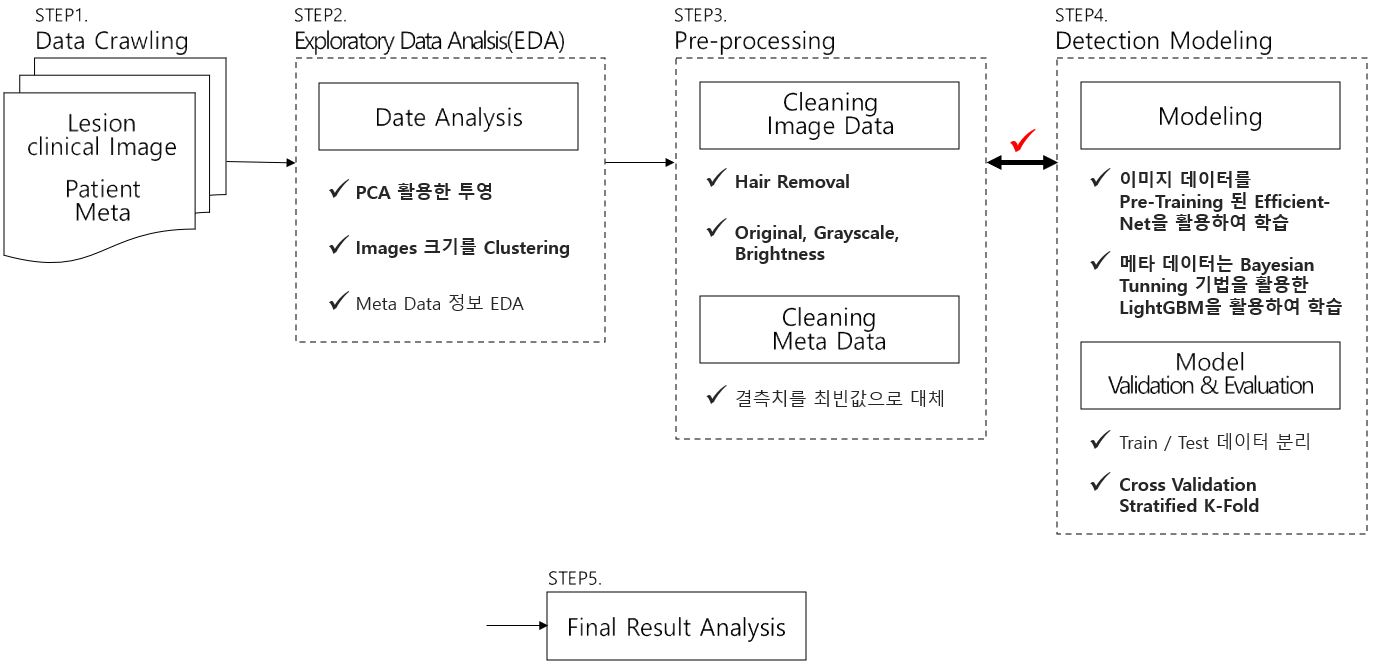
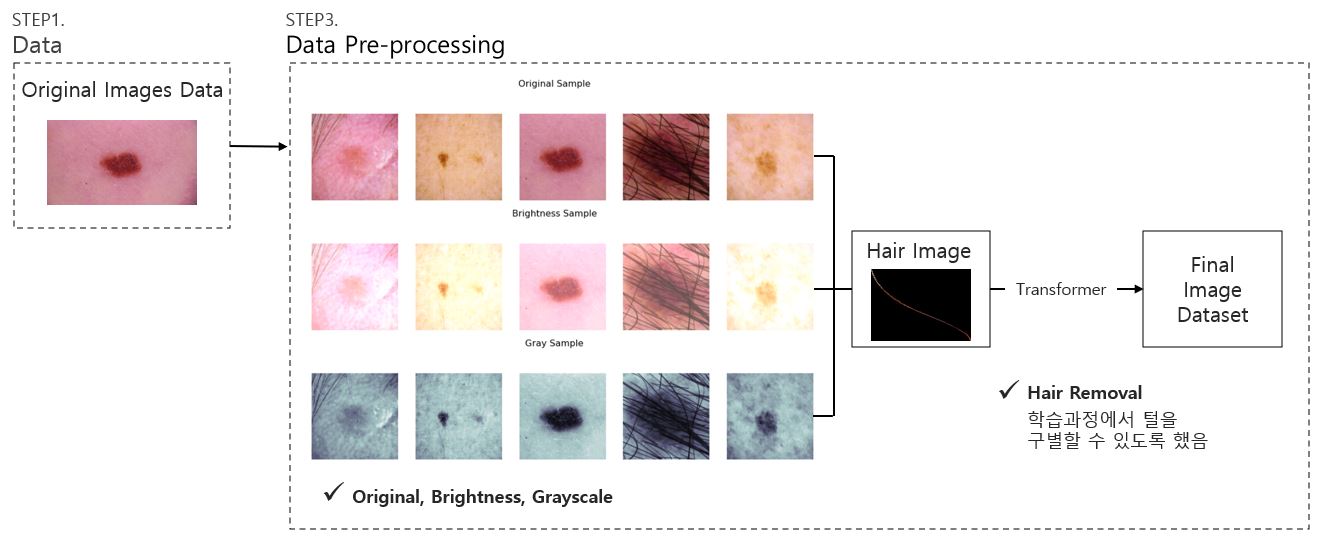
이미지 데이터 전처리
Feature Engineering
meta data에 관하여 GBDT 모델을 사용하기 위해 Feature Engineering을 수행
- sex_enc: 성별을 이진화
- age_enc: 나이를 구간별로 나누어 label encoding함
- age_approx_mean_enc: age_enc를 mean_encoding 함
- anatom_enc: anatom_site_general_challenge를 label encoding함
- n_images: image의 개수를 feature로 만듬
- n_images_enc: n_images를 label encoding 함
- image_size: image 크기를 feature로 만듬
- image_size_scaled: image_size를 Min Max Scaler를 사용
- image_size_enc: image_size를 categorize하여 label encoding을 수행
- age_id_min: 환자의 id 중 나이가 가장 적은 값을 feature로 만듬
- age_id_max: 환자의 id 중 나이가 가장 많은 사람을 feature로 만듬
Hyperparameter Tunning 전략
- 베이즈 최적화 이론
- 베이즈 최적화란 직전까지 계산한 매개변수에서의 결과에 기반을 두고 다음 탐색해야 할 매개변수를 베이즈 확률구조로 선택하는 방식
- TPE
-
기대향상(EI)은 어떤 매개변수로 모델의 점수를 계산 했을때 점수 계선량의 기댓값을 지금까지의 탐색 이력에 추정한 값이다.
-
TPE(Tree-structured Parzen Estimator)는 기대 향샹의 계산에 필요한
 을 구하는 하나의 방법이다
 -
기대향상 수식 및 코드 구현

from optuna.samplers import TPESampler
import optuna

class BayesianOptimizer:
    def __init__(self, objective_function: object):
        self.objective_function = objective_function

    def build_study(self, trials: int, verbose: bool = False):
        sampler = TPESampler(seed=42)
        study = optuna.create_study(
            study_name="parameter_opt",
            direction="maximize",
            sampler=sampler,
        )
        study.optimize(self.objective_function, n_trials=trials)
        if verbose:
            self.display_study_statistics(study)
        return study

    def display_study_statistics(study: optuna.create_study):
        print("Best Score:", study.best_value)
        print("Best trial:", study.best_trial.params)
    ...
-
- 실행 방법
$ python lgbm_optim.py --fold [fold의 수] --params [params 이름].pkl --trials [반복 수] --path [데이터 경로]
Cross-Validation 전략
- K-Fold의 문제점
- K-Fold의 경우 일정한 간격으로 잘라서 사용하여 y라벨링의 값에 불균형한 영향을 줄 수 있다.
- 이러한 문제점을 해결하기 위해 나온 것이 stratified kFold이다.
- Stratified K-Fold는 target에 속성값의 개수를 동일하게 가져감으로써 kfold와 같이 데이터가 한 곳으로 몰리는 경향을 방지한다. K-fold 설명
Train
-
Efficent-Net을 활용하여 이미지 데이터 학습
-
Boosting 모델을 학습 후 앙상블 진행
-
딥러닝의 모델이 하이퍼파라미터 튜닝을 한 LightGBM보다 성능이 좋았으나,둘의 학습 방법은 확연히 다르므로 배깅 기법을 통해 weighted sum을 하여 predict를 함
-
모델 구성도
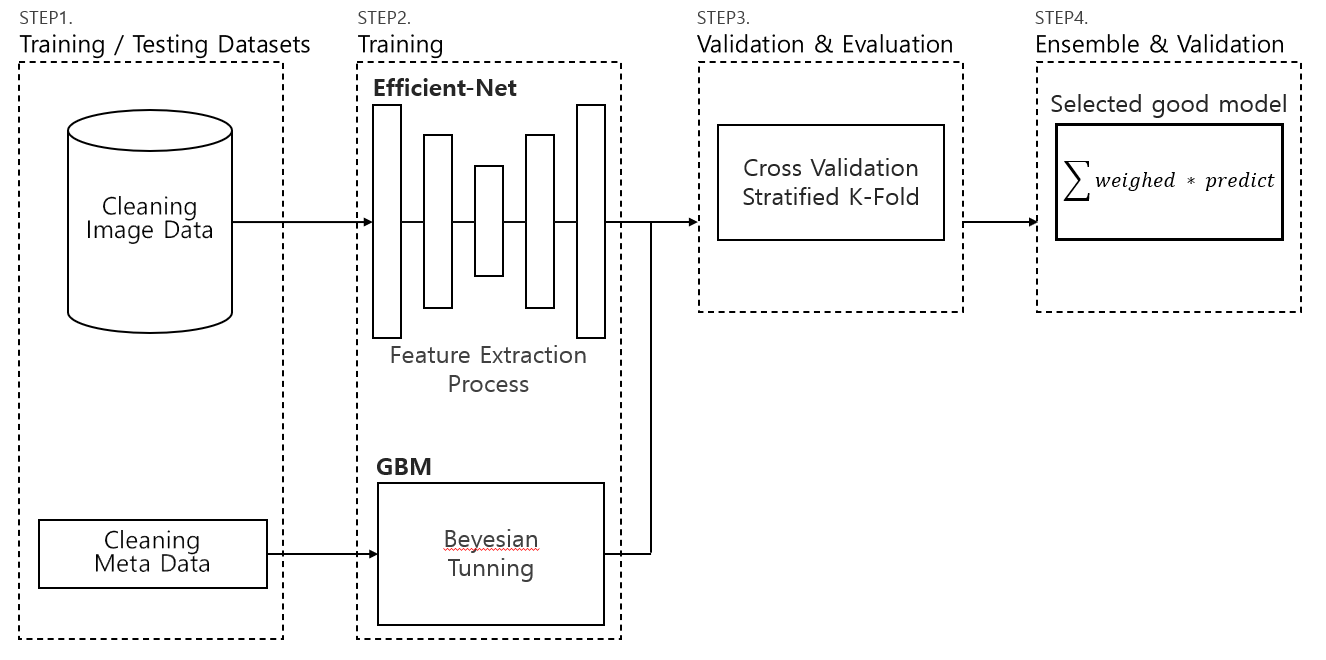
-
실행 방법
$ python train.py --fold [fold 수] --path [데이터 경로] --params [최적 파라미터 이름]
BenchMark
Tabular-learning
| model | OOF(5-fold) | OOF(10-fold) |
|---|---|---|
| LightGBM(before hyper parameter tunning) | 0.84585 | 0.84472 |
| LightGBM(after hyper parameter tunning) | 0.85360 | 0.85864 |
| CatBoost(before hyper parameter tunning) | 0.84594 | 0.84606 |
| CatBoost(after hyper parameter tunning) | 0.84360 | 0.84485 |
| XGBoost(before hyper parameter tunning) | 0.85893 | 0.85022 |
| XGBoost(after hyper parameter tunning) | 0.84347 | 0.84705 |
Image-learning
| model | Epoch 5 | Epoch 10 |
|---|---|---|
| Efficent Net | 0.87646 | 0.89759 |
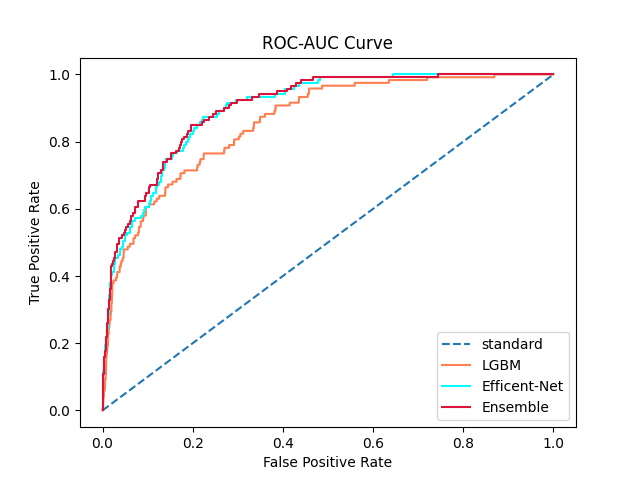
Ensemble Model
| model | ROC-AUC-Score |
|---|---|
| 0.9 * Effinet + 0.1 * LGBM | 0.90042 |
| 0.8 * Effinet + 0.2 * LGBM | 0.90172 |
| 0.7 * Effinet + 0.3 * LGBM | 0.90158 |
| 0.6 * Effinet + 0.4 * LGBM | 0.90056 |
| 0.5 * Effinet + 0.5 * LGBM | 0.90052 |
 |