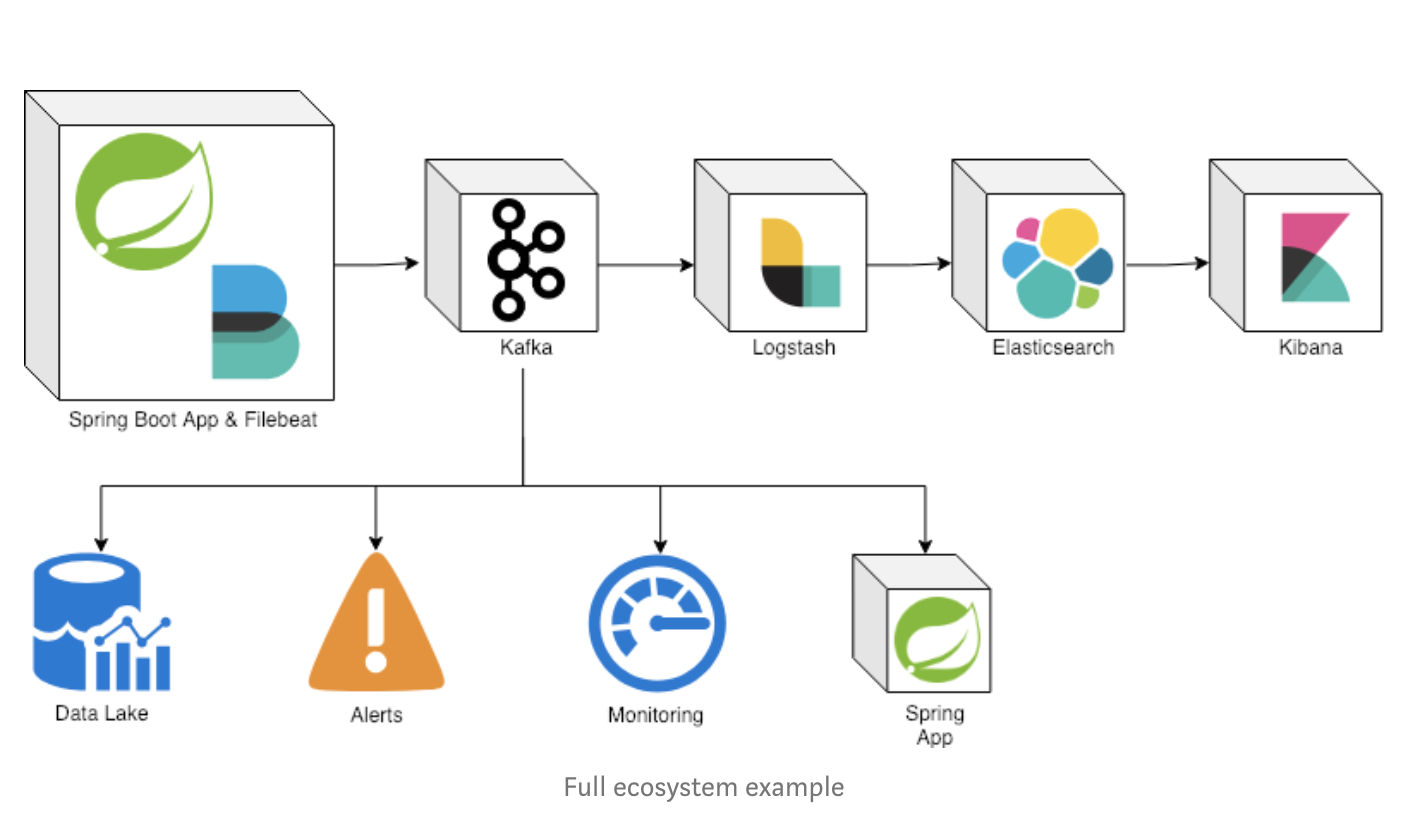
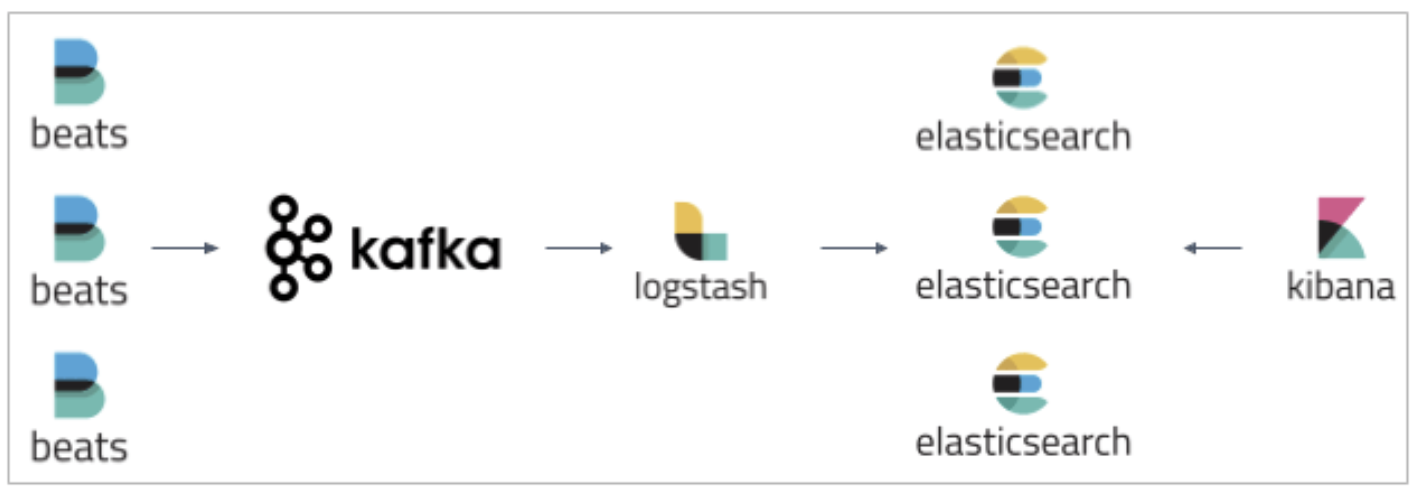
The goal of this project is to implement centralized logging mechanism for spring boot applications.
-
Open a terminal and inside
elkkroot folder rundocker-compose up -d -
Wait a until all containers are Up (healthy). You can check their status by running
docker-compose ps
Inside elkk root folder, run the following Gradle commands in different terminals
-
application
./gradlew :application:bootRun
-
In a terminal, make sure you are in
elkkroot folder -
In order to build the applications docker images, run the following script
./build-apps.sh
-
application
Environment Variable Description ZIPKIN_HOSTSpecify host of the
Zipkindistributed tracing system to use (defaultlocalhost)ZIPKIN_PORTSpecify port of the
Zipkindistributed tracing system to use (default9411)
-
You can then access kibana in your web browser: http://localhost:5601.
-
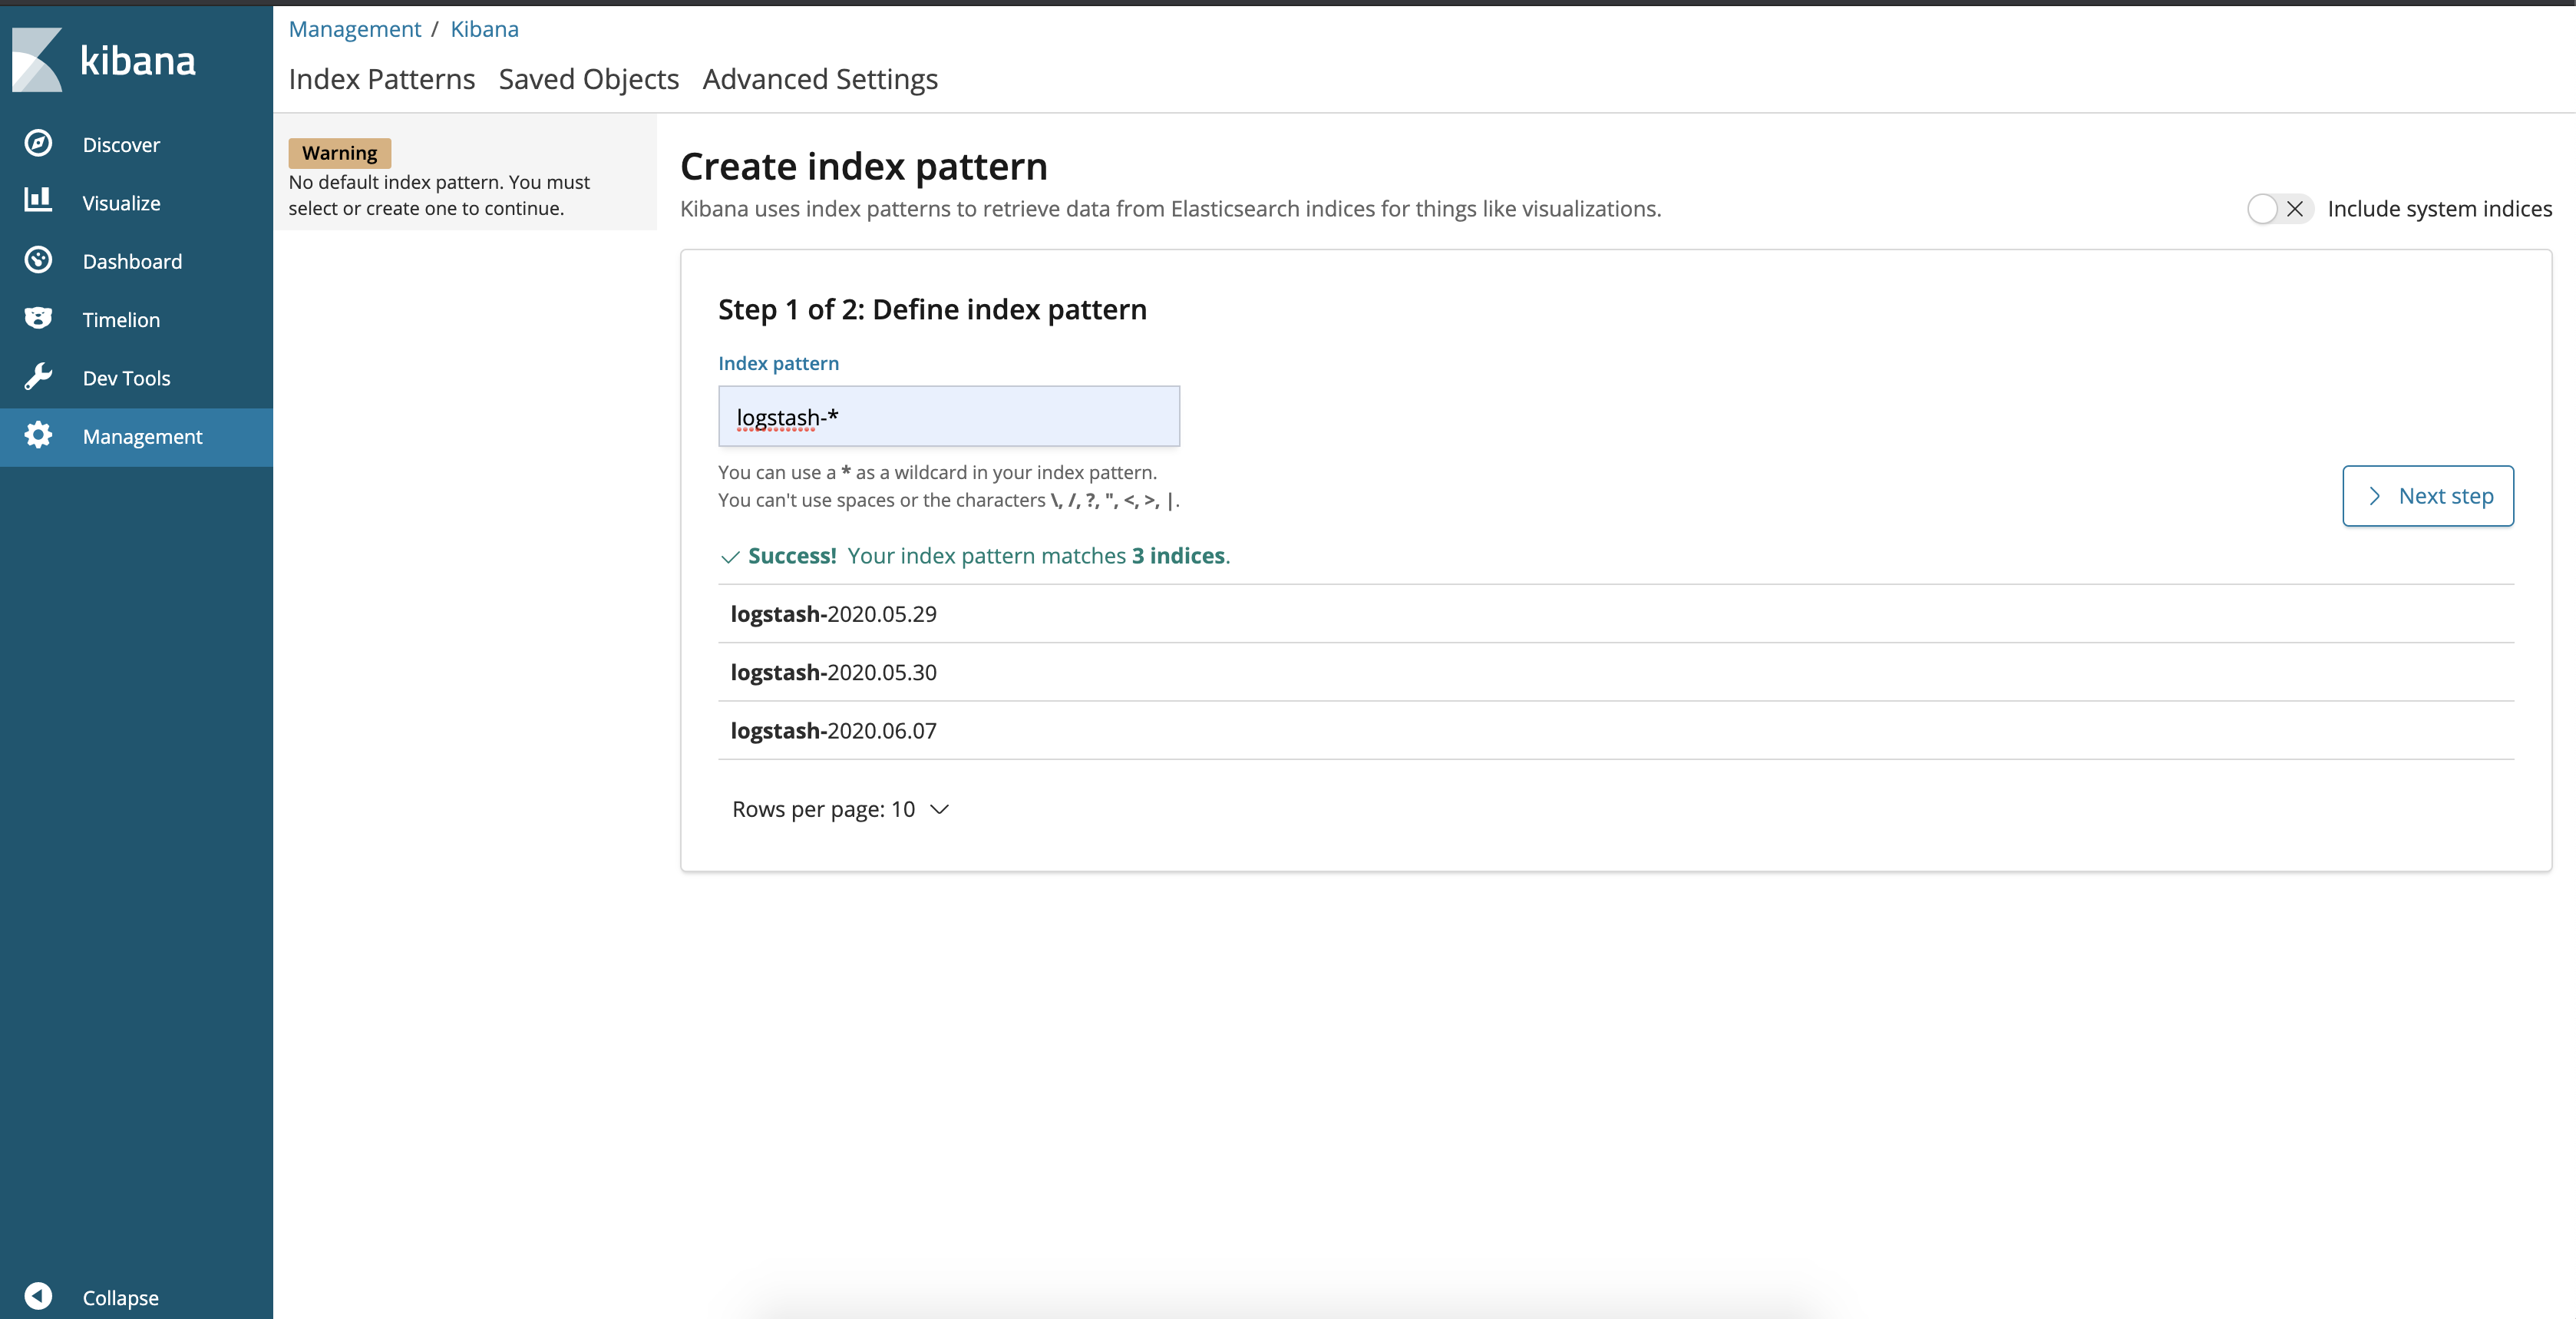
The first thing you have to do is to configure the ElasticSearch indices that can be displayed in Kibana.
-
You can use the pattern logstash-* to include all the logs coming from FileBeat via Kafka.
-
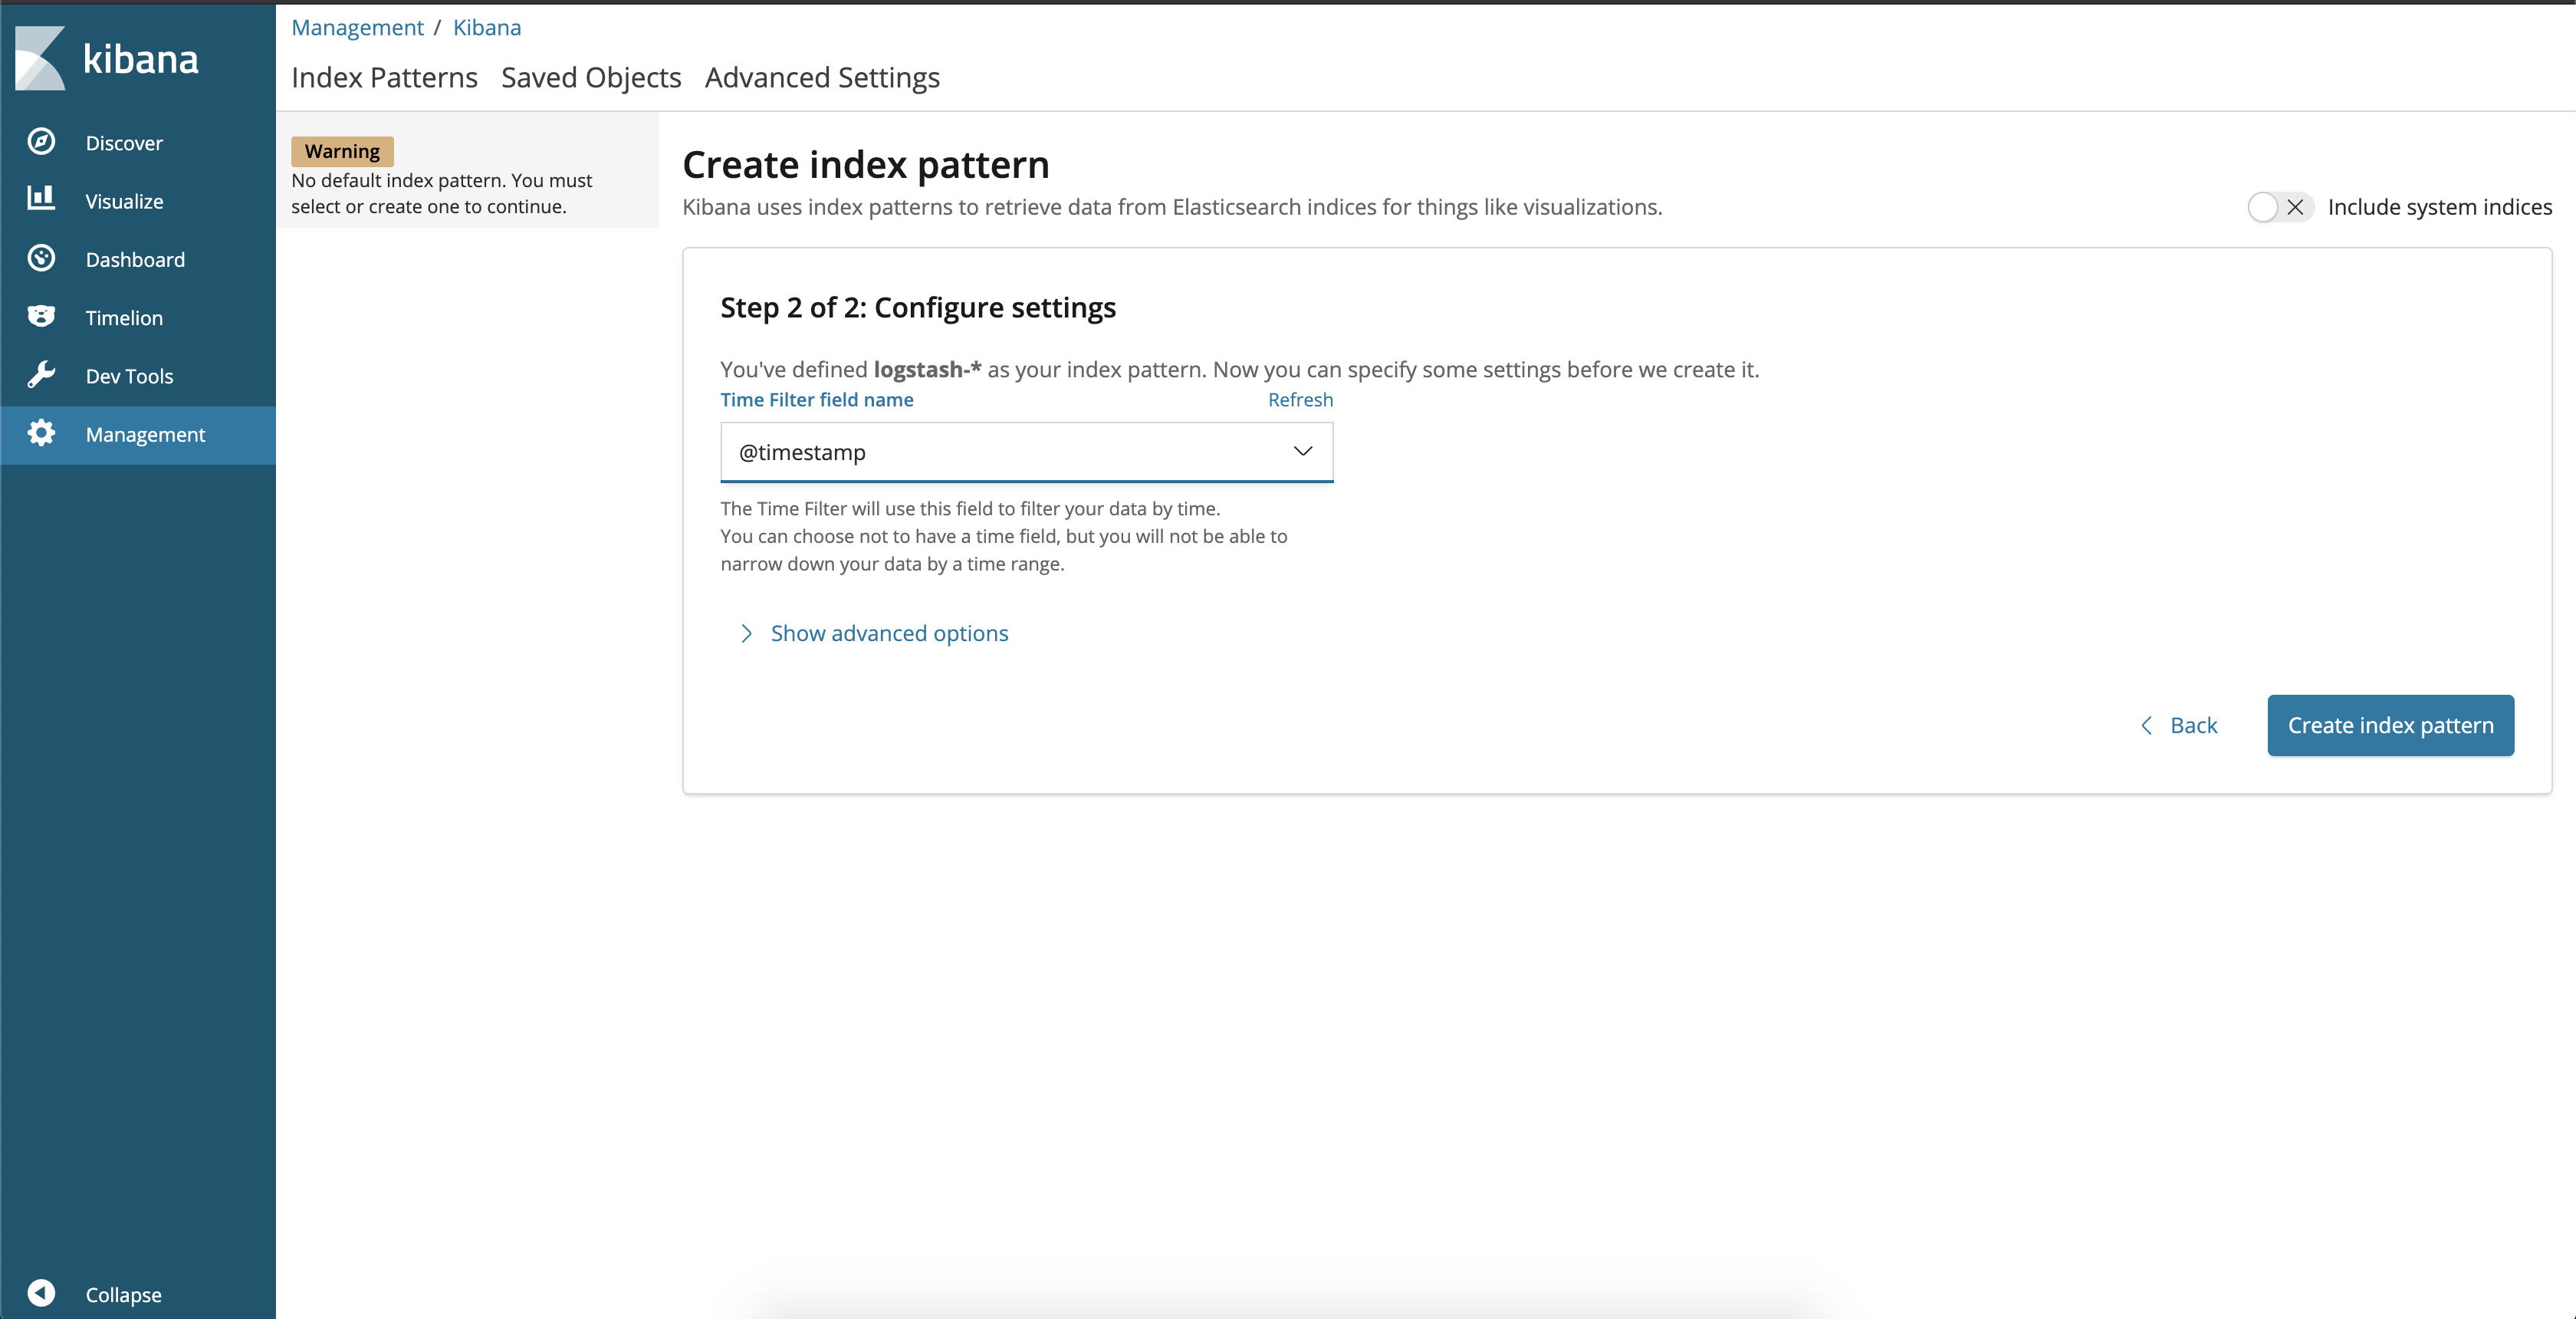
You also need to define the field used as the log timestamp. You should use @timestamp as shown below:
-
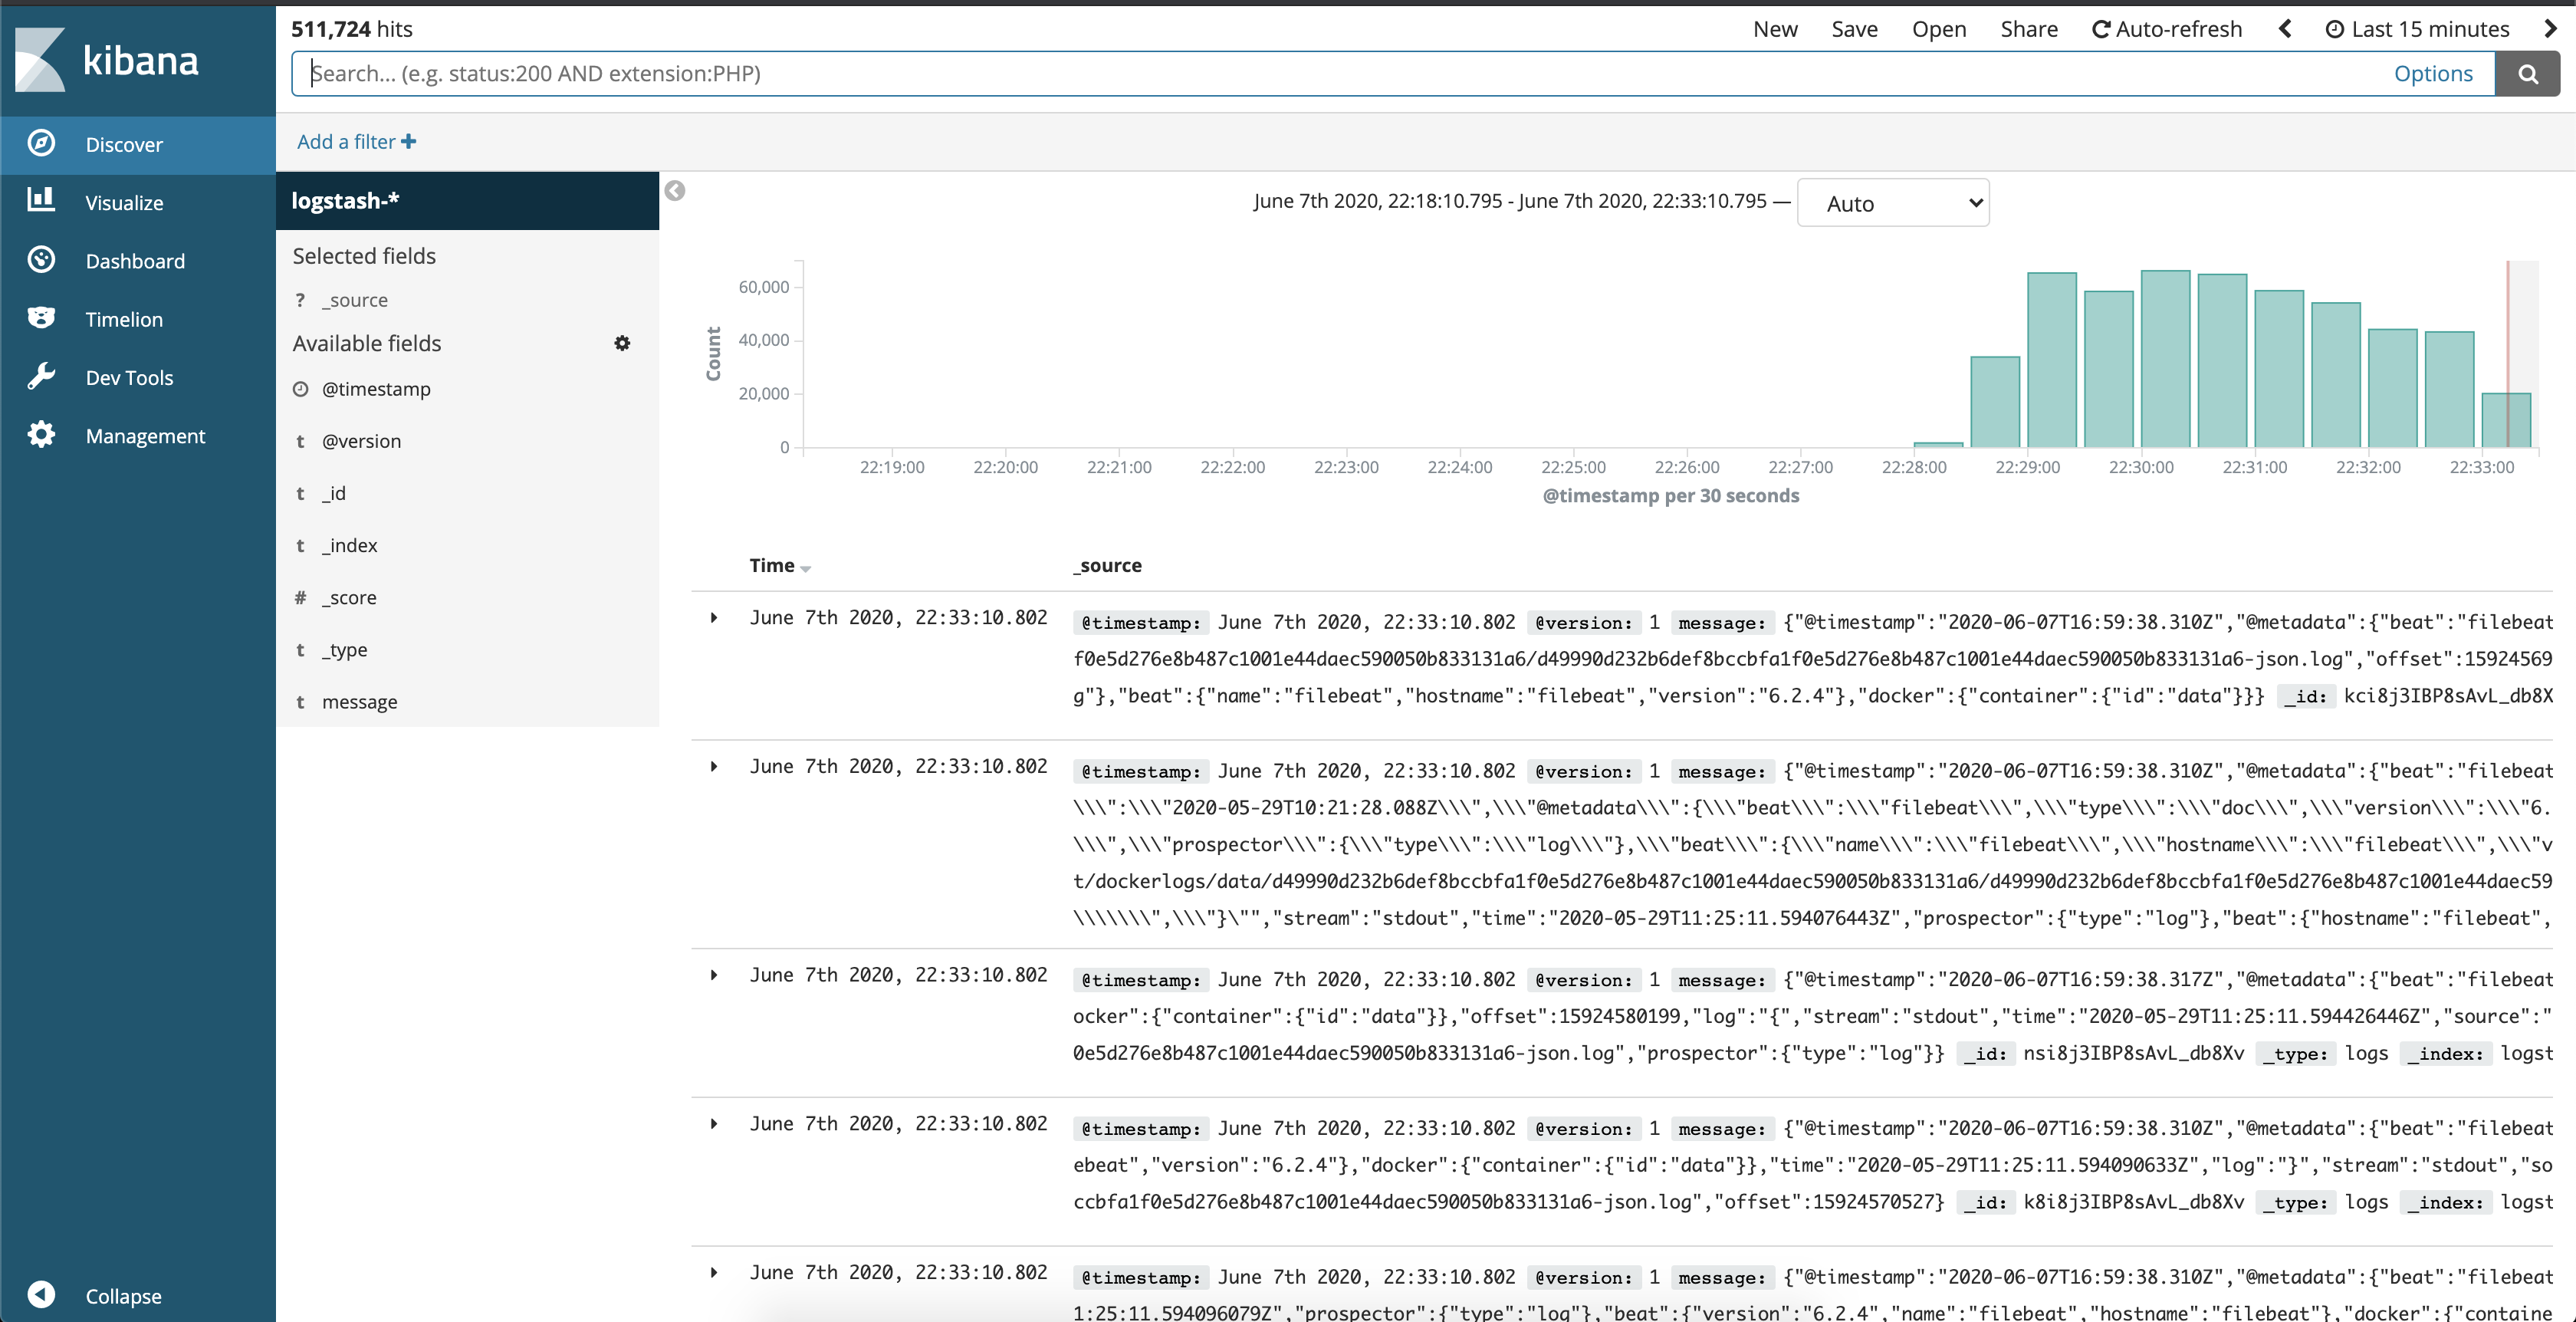
And you are done. You can now visualize the logs generated by FileBeat, ElasticSearch, Kibana and your other containers in the Kibana interface:
| Application | URL |
|---|---|
application |
|
kibana dashboard |
-
Stop applications
-
If they were started with
Gradle, go to the terminals where they are running and pressCtrl+C -
If they were started as a Docker container, run the script below
./stop-apps.sh
-
-
Stop and remove docker-compose containers, networks and volumes
docker-compose down -v
-
Kafka Topics UI
Kafka Topics UIcan be accessed at http://localhost:8085 -
Zipkin
Zipkincan be accessed at http://localhost:9411 -
Kafka Manager
Kafka Managercan be accessed at http://localhost:9000Configuration
-
First, you must create a new cluster. Click on
Cluster(dropdown button on the header) and then onAdd Cluster -
Type the name of your cluster in
Cluster Namefield, for example:MyZooCluster -
Type
zookeeper:2181inCluster Zookeeper Hostsfield -
Enable checkbox
Poll consumer information (Not recommended for large # of consumers if ZK is used for offsets tracking on older Kafka versions) -
Click on
Savebutton at the bottom of the page.
-
-
Elasticsearch REST API
Check ES is up and running
curl http://localhost:9200Check indexes in ES
curl http://localhost:9200/_cat/indices?vCheck news index mapping
curl http://localhost:9200/news/_mappingSimple search
curl http://localhost:9200/news/news/_search
