Insight into so many problems in Electrical Engineering can be seen from the examination of the Potential (Voltage) or Electric Field map of the space around the problem. Dielectric breakdown, spark, antenna design - all of these can really be aided by looking into the details of the electric fields. It's a very powerful tool, so I decided to create a tool to visualize these fields very simply and easily.
I've had Macs since the days they were driven by the 68000-family. Then they moved to the Power PC family, and I was thrilled, but the one thing that the Intel x86 chipset always had was the numeric coprocessor, and while the 68040 existed, the Power PC had no equivalent, so there was no way to make a really good numerical simulation for the Mac.
Then Steve moved the Mac to x86, and the vecLib Framework shipped with
Mac OS X, and it included BLAS and LAPACK, which I've used extensively in
other areas. So now I could create the kind of application to visualize the
fields around general conductors, dielectrics, charge sheets.
The current code reads an input deck - very much like the old SPICE decks,
solved for V(x,y) and from that, E(x,y). The input deck looks something
like:
#
# Comment lines start with a #
#
# The workspace line is of the form:
#
# WS <x> <y> <width> <height> <rows> <cols>
#
# where:
#       <x> <y> - the origin of the workspace
#       <width> - the width of the workspace
#       <height> - the height of the workspace
#       <rows> <cols> - the rows and columns of the simulation grid
#
# Format of each sim object line is:
#
# <shape><type> <x> <y> <shape_options> <type_options>
#
# followed by type/shape specific information. The following are supported:
#
# <shape> = C - Circle
#           R - Rectangle
#           L - Line
#           P - Point
#
# <type>  = M - Metal
#           D - Dielectric
#           C - Charge Sheet
#
# and the <shape_options> are specific for each shape:
#
#       CIRCLE:
#               <shape_options> = <radius>
#
#       RECTANGLE:
#               <shape_options> = <width> <height>
#
#       LINE:
#               <shape_options> = <endx> <endy>
#
#       POINT:
#               <shape_options> are not applicable
#
# and the <type_options> are specific for each shape:
#
#       METAL:
#               <type_options> = <voltage>
#
#       DIELECTRIC:
#               <type_options> = <epsilonR>
#
#       CHARGE SHEET:
#               <type_options> = <rho>
#
WS 0.0 0.0 10.0 10.0 50 20
LM 0.0 0.0 10.0 0.0 0
LM 0.0 10.0 10.0 10.0 1
RC 2.5 2.5 2.5 2.5 10.0
PM 5.0 5.0 50
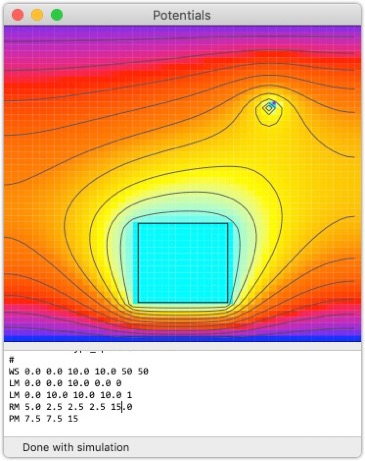
The output is generated in the UI, and looks something like this:
Now that it's on Xcode 10.2, I want to visualize the results - both V(x,y)
and E(x,y) - and then we'll work on creating the workspaces with drawing
tools so that the input deck is unnecessary.
Much more to come.
