🧩 Web Tiles Viewer
🧭 Overview
Web Tiles App - web application for viewing satellite data in raster and vector format.
🎯 Target audience
This application can be useful both for individual users-cartographers, to view satellite data available via the XYZ/TMS protocols, and for companies that need to visualize their data for their users and customers.
⚙️ Functionally
The application contains a full-screen web map and a control panel for data layers, the user can add / remove data layers, as well as change the base map background. It is also possible to pass the configuration of the displayed layers when opening the application by link, in the url parameters, this will allow you to create static links for viewing.
📝 Development plan
Defining the stack
- Next.js -
ssrwill not be used in this case, because web maps are incompatible with it, but it is very useful to be able to easily and quickly configure the api, it is also useful for proxying requests to tiles, if the user, for example, specifies anhttplink, this would be a problem if you try to use such a link, because the web browser,google chrome, for example, prohibits data from non -httpresources, while our site useshttps - Typescript - strong typing will help to minimize the number of possible errors in the development process
- Blueprint.js - a convenient and functional set of components for
React - mapbox-gl - when choosing a library for a web map, I had to choose between
open-sourcesolutions andmapbox-glrecently not open-source, why the 'mapbox-gl' library continues to evolve and has a set of pretty styles available only withaccessToken, as well as there are flexible options for customizing the display of vector data. As an alternative, I considered: maplibre-gl, open-source forkmapbox-glandopenlayers. Mapbox-gl has a fairly generous free tier, because in the near future there will be no big traffic for this project, although who knows😏 - tailwindcss - in addition to the wonderful
blueprint.js, I wanted to be able to quickly and flexibly customize the styles and position our components,tailwindcssis perfect for these purposes, they do not conflict with each other as far as I know
🖥️ Mockup plan
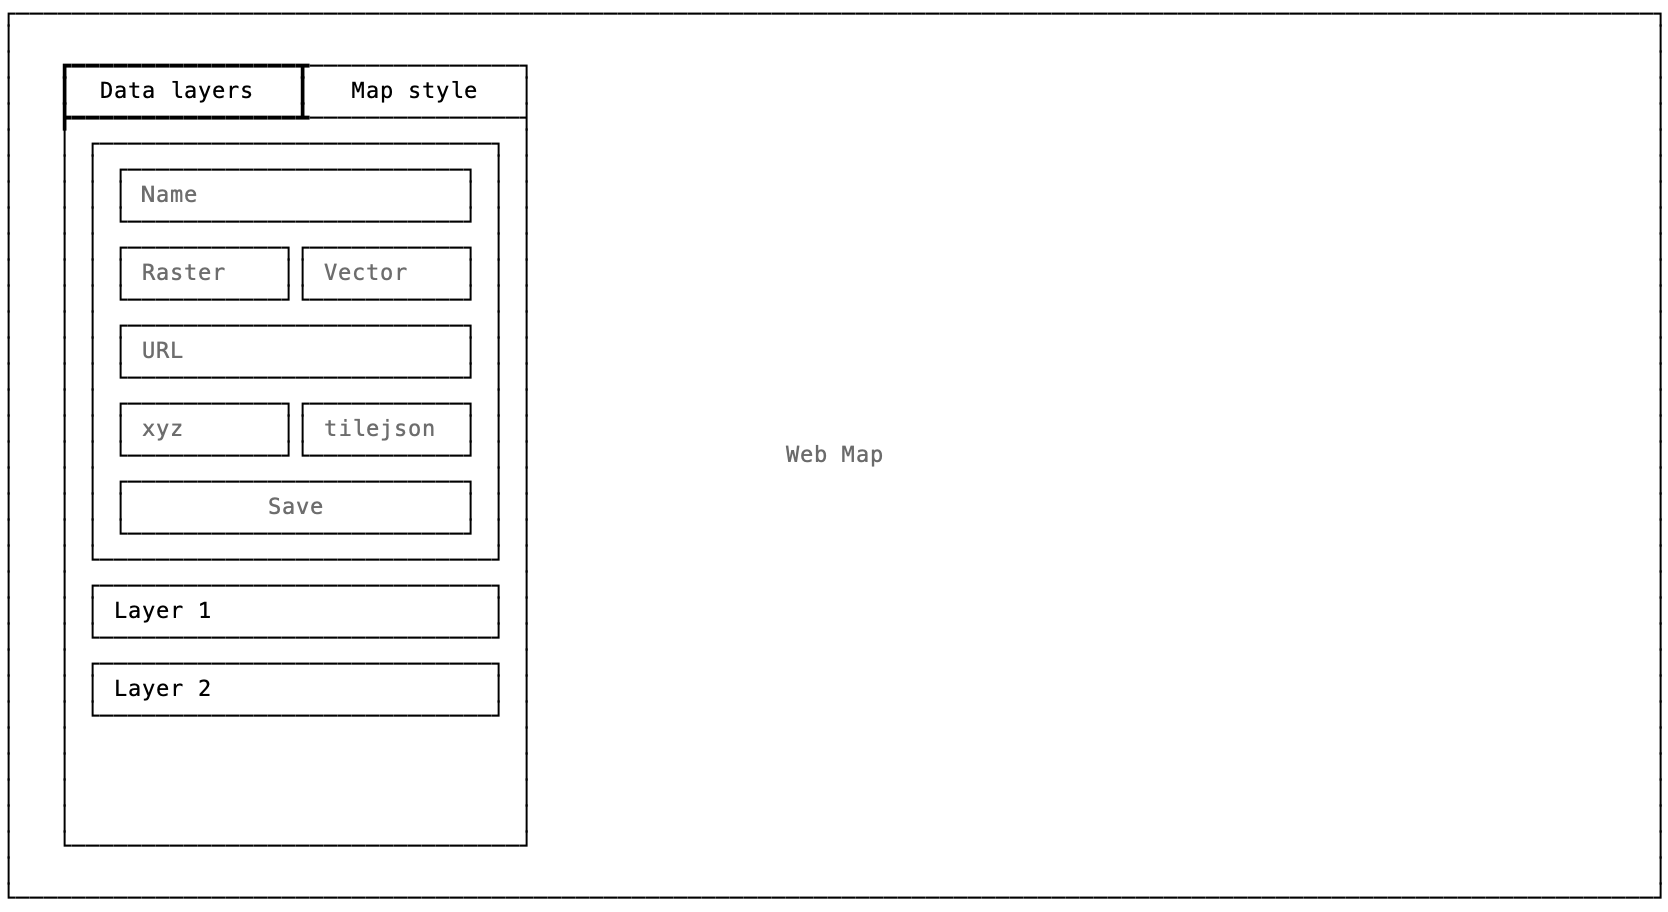
Initial screen
Main elements:
- Full screen web map
- Sidebar for managing layers, it contains tabs:
- Data layers - contains a list of vector/raster layers displayed on the map with the ability to customize their display, add and remove layers
- Map style - contains a list of map styles available for display, the user can change the current style or add his own
New data layer form
New data layer form contains:
- Layer name - optional
- Layer type - векторный или растровый
- URL - url слоя
- URL type - tile url template or tilejson url
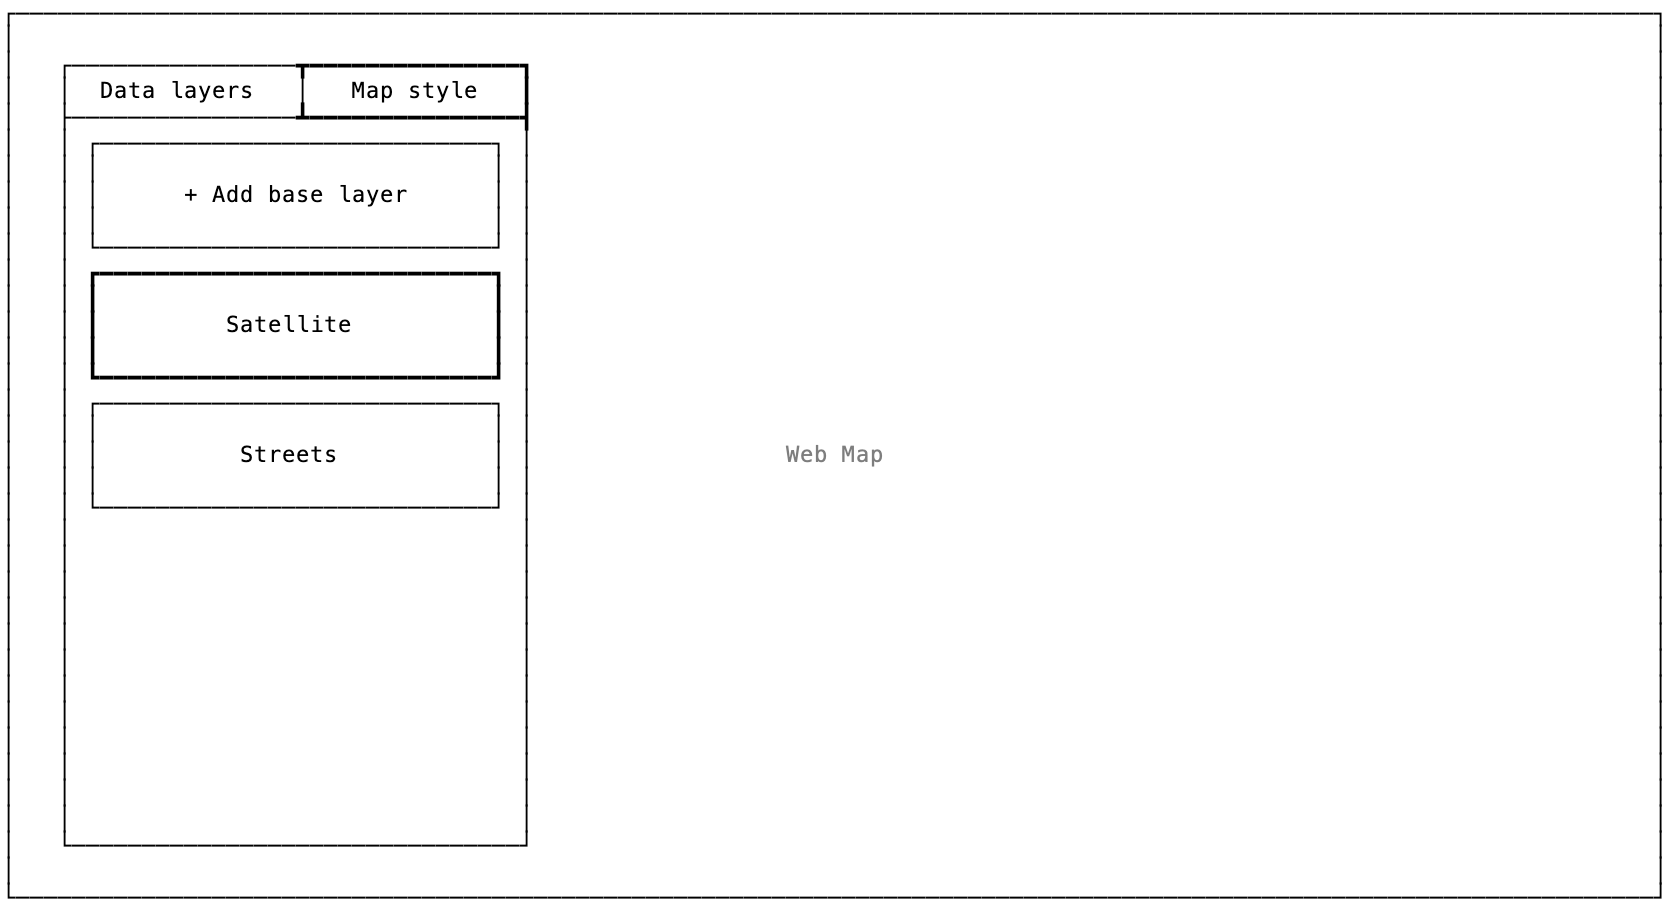
Map style tab
On the map style control tab, the available styles are displayed, the user can see the current active style, switch it, or add a new one
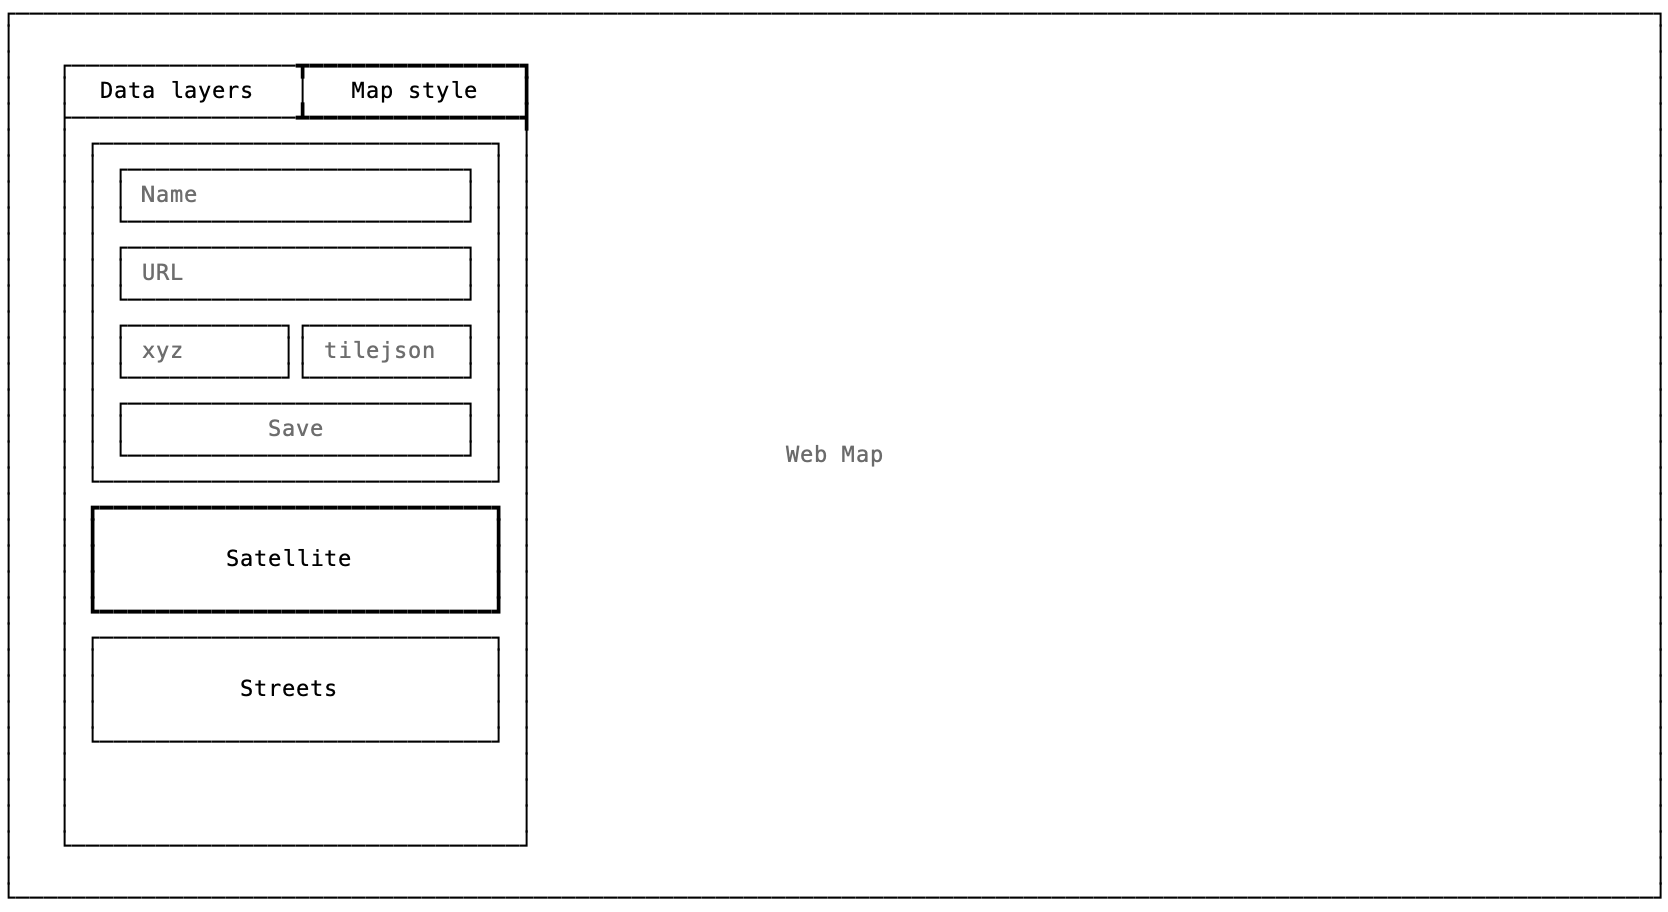
New map style form
The form for adding a base layer is similar to the form for adding a data layer
🔄 Data flow chart
🏫 App architecture overview
The key component of the application is the state object that is planned to be implemented using the XState library
- Application state will store information about added data layers and map styles
mapbox-glhas its own internal state, which describes the current viewport of the map and the configuration of the data layers and themap style- https tiles prox will proxy http requests to tiles as https, which will allow the user to use http links to data layers, this will be useful because it is not always possible to use an https link, for example, if the user has a local tile-server running
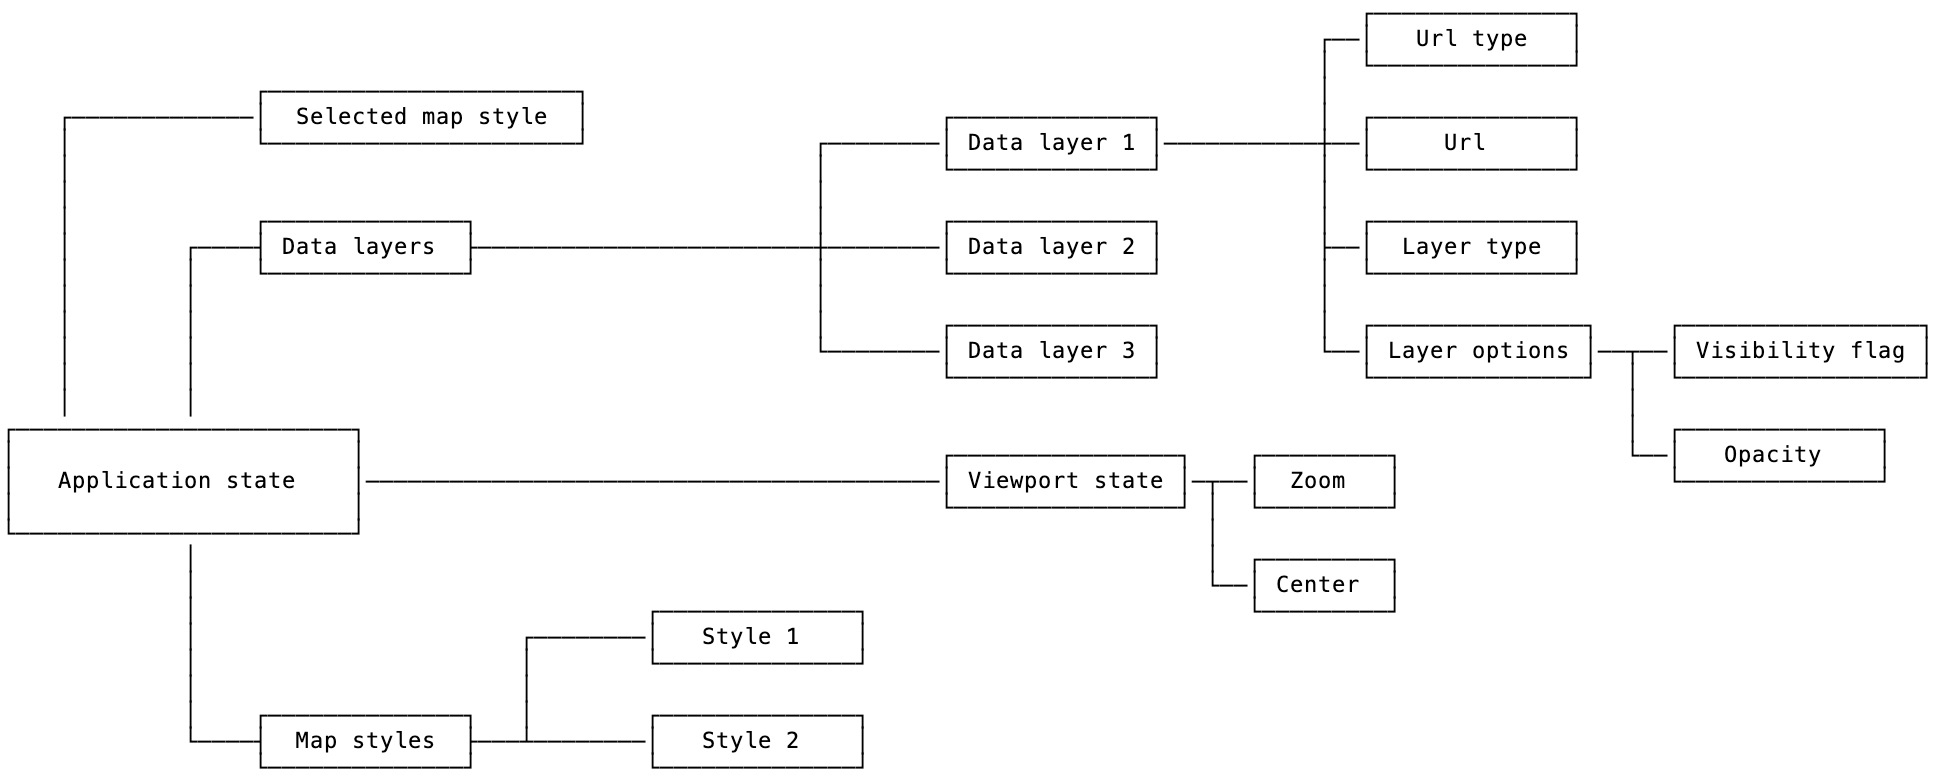
🔎 Application state in details
Let's take a closer look at the state of the application:
- Data layer includes
- Url - link to the data layer, more about slippy maps and about [tilesets](https: // docs. mapbox.com/help/glossary/tileset/)
- Url type - 2 types of url are accepted:
- Layer options
- Visibility flag - takes values 0 or 1, if 0 is set then the layer is not displayed and vice versa
- Opacity - the transparency value of the layer, takes values from 0 to 1 where 0 - the layer is completely transparent
- Layer type can be either
vectororraster
💬 User stories
What I love about user stories is that in the process of creating them, we can discover new useful features that we might have missed
As I said before there is two types of users
- Cartographers - we will call them
core users - Companies - we will call them
company users
Let's assume some user stories for them
As a
core userI want to add data layers to the web map
To be able to view them
As a
core userI want to be able change visibility and opacity of data layers
To configure the appropriate display mode for data layers
As a
core userI want to be able change map style
To choose the most suitable layout for web map
As a
core userI want to share my visualization
To be able to show it to others or save it as static link
As a
company userI want to open the
Web Tiles Viewerwith predefined configTo create direct links to view my data


